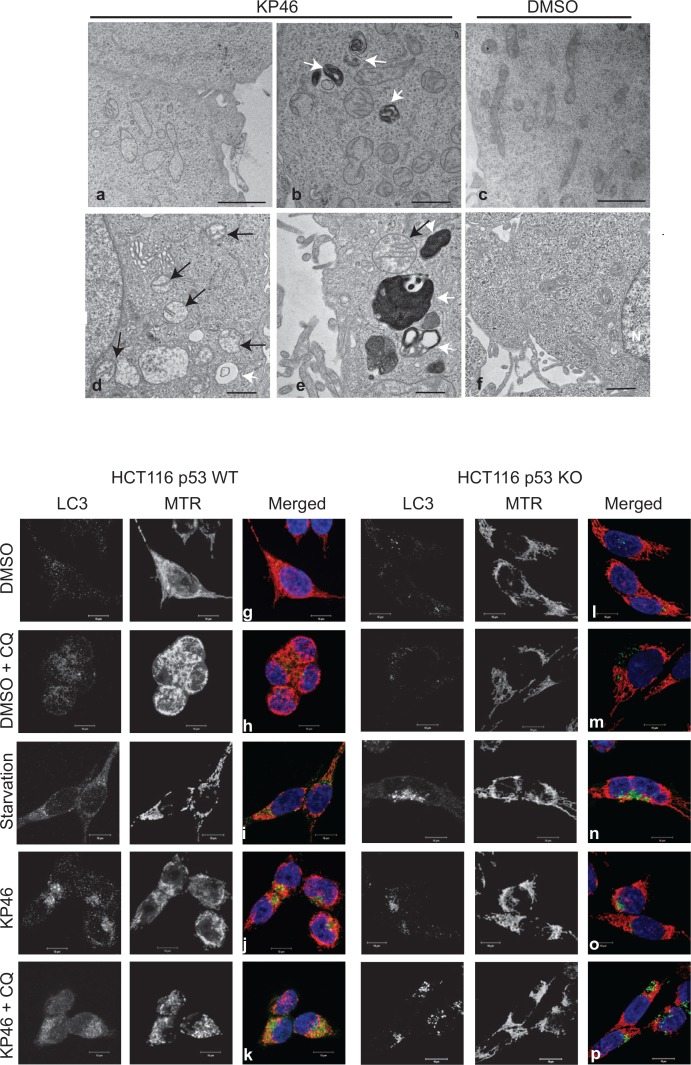
Figure 1. KP46 targets mitochondria a–f.
Time course electron microscopy was performed on cells treated with 2.5 μM KP46 (a, b, d, e) or with vehicle (c, f) for 4 hours (a, b, c), 24 hours (d, e) and 48 hours (f). White arrows point autophagosomal structures, black arrows mitochondria. Scale bars: 2 μm (a, c), 1 μm (b,d,f) and 0.5 μm (e). g–p. HCT116WT (g–k) and HCT116 p53KO (l–p) were exposed to vehicle or 2.5 μM KP46 for 4 hours, in presence or absence of chloroquine (CQ, h, m, k, p) or exposed to starvation for 24 h (I, n), stained with MTR (red) and DAPI (blue), labelled with an antibody against LC3 (green) and visualised by immunofluorescence microscopy. Scale bars: 10 μm.

