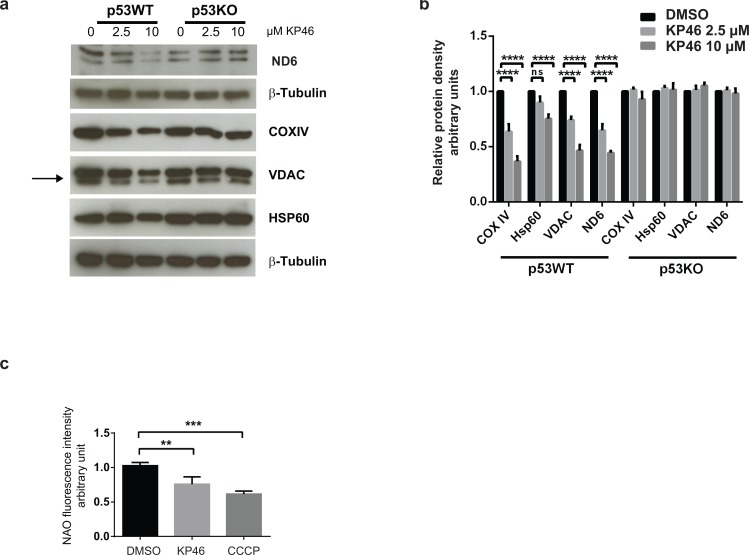
Figure 3. KP46 decreases mitochondrial protein content and mass.
a. HCT116WT and HCT116 p53KO were exposed to vehicle or KP46 2.5 or 10 μM for 6 hours. Protein lysates were immunoblotted with the indicated antibodies. β–Tubulin served as loading control. b. Relative protein density of Hsp60, VDAC, COXIV, ND6 normalized to β-Tubulin. n = 3, two-way ANOVA, Bonferroni's multiple comparisons test. ****p < 0.0001 c. HCT116WT cells were exposed to vehicle, KP46 2.5 μM for 6 hours or 50 μM CCCP for 2 hours, stained with NAO and subjected to flow cytometry. Shown are the mean fluorescence intensities ±SD (n = 3), ***p < 0.001, **p < 0.01, one-way ANOVA, Dunnett's multiple comparisons test, ****p < 0.0001.

