
Figure 3. Leptin induces MFE in breast cancer cells.
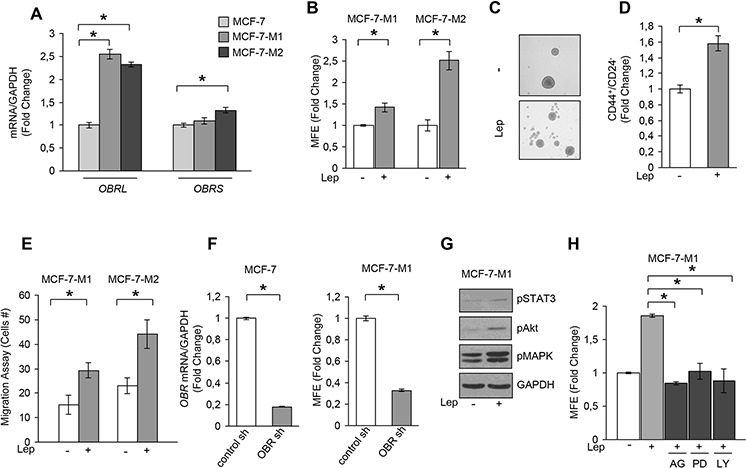
A. Leptin receptor long (OBRL) and short (OBRS) isoform mRNA levels, evaluated by real time RT-PCR, in MCF-7, MCF-7-M1 and MCF-7-M2 cells. Each sample was normalized to its GAPDH mRNA content. B. MFE in MCF-7-M1 and MCF-7-M2 in the presence or absence (−) of leptin 500 ng/ml (Lep). C. Representative phase-contrast images of mammospheres treated as in panel (B) are shown. D. CD44+/CD24− population in MCF-7-M2 cells treated or not (−) with Lep. E. Transmigration assays in MCF-7-M1 and MCF-7-M2-derived cells treated or not (−) with Lep. F. MCF-7 cells were stably transfected with either a scrambled shRNA (control-sh) or OBR shRNA (OBR-sh). OBRL mRNA content was evaluated by real time RT-PCR (left panel). Each sample was normalized to its GAPDH mRNA content. MFE in MCF-7-M1 derived from either control-sh or OBR-sh clones (right panel). G. Immunoblotting of phosphorylated (p), STAT3 (Tyr705), Akt (Ser473), and MAPK (Thr202/Tyr204) at the indicated residues measured in cellular extracts from MCF-7-M1 cells treated or not (−) with Lep. GAPDH, loading control. H. MFE in MCF-7-M1 treated with Lep and AG490 (AG-20 μmol/L), PD98059 (PD-10 μmol/L) or LY294002 (LY-10 μmol/L). The values represent the means ± s.d. of three different experiments each performed in triplicate. *p < 0.05.