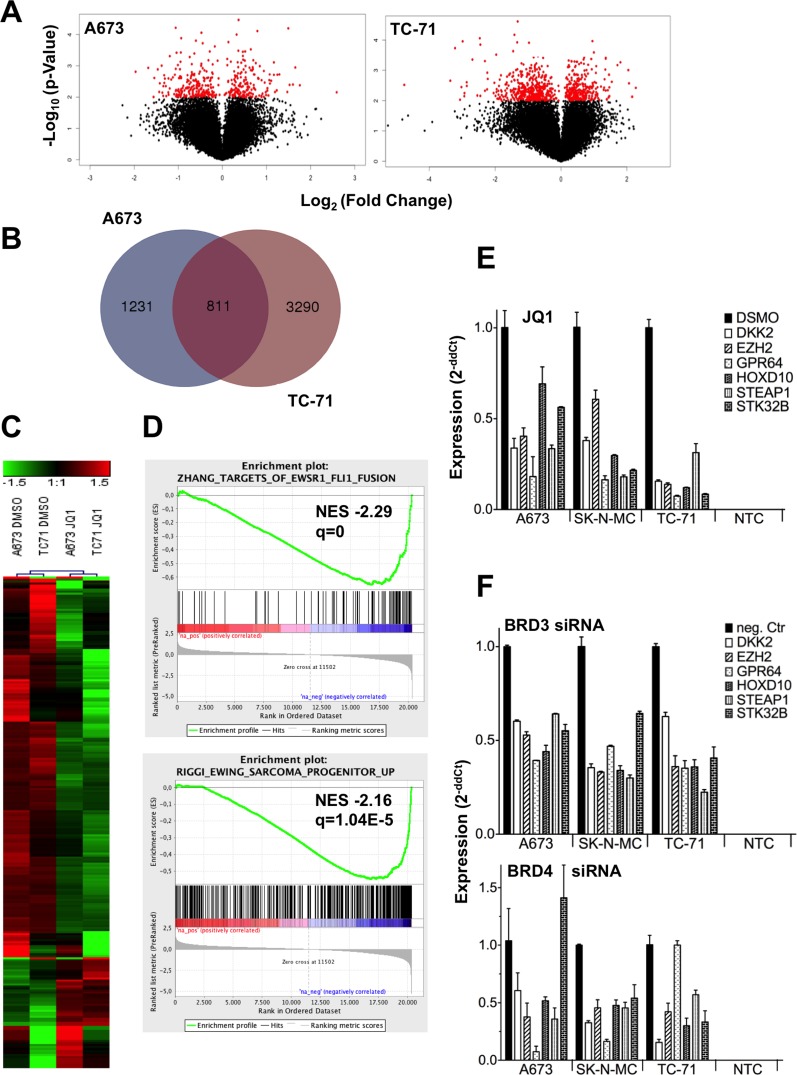
Figure 2. ES expression profile after JQ1 treatment or RNA interference of BRD genes blocks a typical ES associated expression program.
A. Volcano plot for DMSO against JQ1 treated ES lines, showing the adjusted significance P-value (−log10) plotted over fold change (log2). Red, genes with a significance P < 0.01. Microarray data with their normalized fluorescent signal intensities were used (RMA, see Materials and Methods; GSE72673). Cells were treated with DMSO or JQ1 for 48hrs, collected, and then analyzed. B. Shared genes differentially expressed after JQ1 treatment in 2 different ES lines. For a Venn diagram genes ± 1.5 fold differentially expressed were selected for the analysis (http://bioinformatics.psb.ugent.be/webtools/Venn/). C. Heat map of 244 genes, 1.8-fold differentially expressed in 2 different ES lines A673 and TC-71 are shown. Each column represents 1 individual array. D. GSEA enrichment plots of down-regulated genes after JQ1 treatment. GSEA: http://www.broadinstitute.org/gsea/index.jsp E. Verification of microarray data by qRT-PCR of selected genes. ES specific genes were significantly down-regulated after JQ1 treatment in different ES cell lines. F. RNA interference of BRD3 or BRD4, respectively with specific siRNAs affects the same ES specific genes as after JQ1 treatment. Results of qRT-PCRs are shown. Data are mean ± SEM; t-test. NTC: non-template control.

