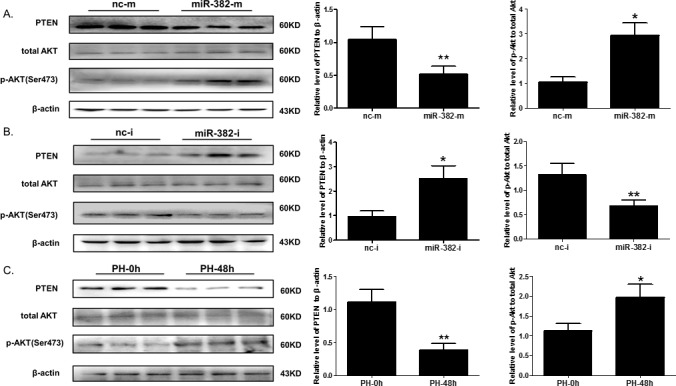
Figure 4. miR-382 negatively correlates with PTEN expression at protein level both in vitro and in vivo.

A. Western blot analysis for PTEN, p-AKT, and total AKT in NCTC1469 cells transfected with miR-382 mimics (miR-382-m) or negative control (nc-m) (n=3). B. Western blot analysis for PTEN, p-AKT, and total AKT in NCTC1469 cells transfected with miR-382 inhibitor (miR-382-i) or negative control (nc-i) (n=3). C. Western blot analysis for PTEN, p-AKT, and total AKT in the mouse liver at 48 hrs after PH (PH-48h) compared with control mouse liver (PH-0h) (n=3). β-actin was used as loading control. *, P<0.05; **, P<0.01.
