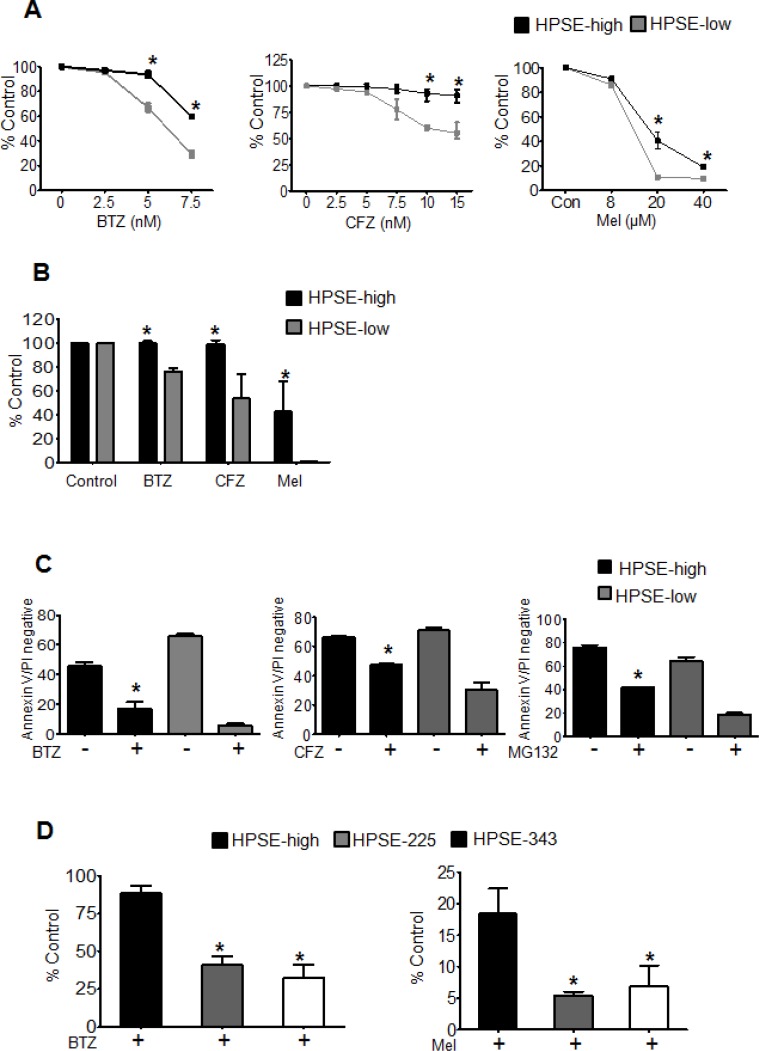
Figure 2. Heparanase promotes chemoresistance.
(A) Stable transfectants of CAG cells expressing either high (HPSE-high) or low (HPSE-low) levels of heparanase were treated with increasing concentrations of bortezomib (BTZ), carfilzomib (CFZ) or melphalan (Mel) for 14 h and cell viability was assessed by MTT assay. *p < 0.05 versus HPSE-low. (B) Differences in cell viability between HPSE-high and HPSE-low after 14 h, treatment with BTZ (5 nM), CFZ (7.5 nM), or Mel (40 μM) as determined by ATPlite™ assay, *p < 0.05 versus HPSE-low. (C) Equal numbers (106 cells/ml) of HPSE-high or HPSE-low cells were treated for 14 h with BTZ (50 nM), CFZ (100 nM) or another proteasome inhibitor MG132 (100 nM) and the percentage of viable cells (Annexin V and Propidium Iodide negative) was determined by flow cytometry, *p < 0.05 versus HPSE-low after drug treatment. (D) Viability of CAG HPSE-high cells and CAG cells expressing enzymatically inactive HPSE (mutations at amino acids 225 or 343; HPSE-225, HPSE-343) as measured by MTT assay after 14 h treatment with BTZ (5 nM) or Mel (40 uM), *p < 0.05 versus HPSE-high. Data are represented as mean ± SEM.

