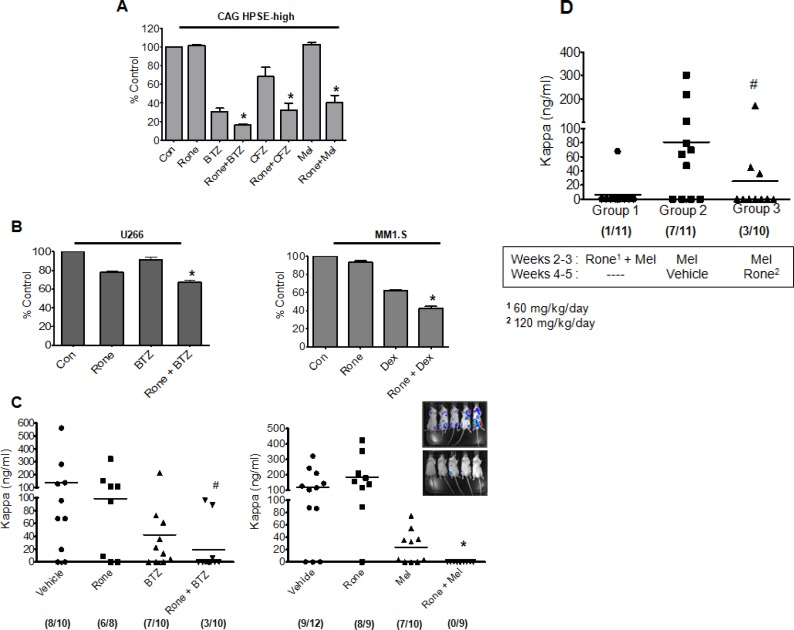
Figure 4. Roneparstat sensitizes myeloma cells to chemotherapy and diminishes relapse.
(A) MTT assay of HPSE-high cells treated with BTZ (7.5 nM), CFZ (15 nM), or Mel (8 μM) for 14 h either alone or following 6 h pretreatment with heparanase inhibitor, Roneparstat (Rone, 6.75 μM), *p < 0.05 versus individual drug treatment alone. (B) (Left panel) MTT assay for myeloma cell line U266 treated with BTZ (5 nM) for 14 h either alone or following 6 h pretreatment with Roneparstat (6.75 μM), *p < 0.05 versus BTZ alone. (Right panel) MTT assay for dexamethasone sensitive myeloma cell line MM1.S treated with dexamethasone (Dex, 50 nM) for 14 h either alone or following 8 h pretreatment with Roneparstat (6.75 μM), *p < 0.05 versus Dex alone. (C) Disseminated tumors were established in SCID mice by intravenous injection of CAG HPSE-high cells and after 7 days animals were sorted into different groups and treatment was initiated. After 14 days of treatment, tumor burden in individual animals was determined by quantification by ELISA of human kappa immunoglobulin light chain in murine sera. Different treatment groups included (Left panel) Roneparstat (120 mg/kg/day) alone, BTZ (0.5 mg/kg/twice weekly) alone, or a combination of Roneparstat (120 mg/kg/day) and BTZ (0.5 mg/kg/twice weekly). We analyzed the combination therapy group for potential outliers using the statistical analyses tool called ROUT (Graph Pad software), that identifies outliers from a nonlinear regression. The maximum false discovery rate (Q) for ROUT test was set to maximum at 0.1000%. In the combination group, the two animals with high kappa levels were found to be outliers by ROUT analyses. However, to avoid any biased interpretation as well as to provide all the available data to the readers, we have not removed these outliers from our results. Due to inclusion of these outliers in the Rone + BTZ group, this group is not significantly different than the BTZ treatment alone group. However, if these two outliers are removed, the combination group is significantly different (p = 0.0065) compared to BTZ alone. Also note that only 3/10 animals in the combination group had detectable tumor vs. 7/10 in the BTZ alone group, #p < 0.05 versus animals treated with Rone alone. (Right panel) Roneparstat (60 mg/kg/day) alone, Mel (1.0 mg/kg/week) alone, or a combination of Roneparstat (60 mg/kg/day) and Mel (1.0 mg/kg/week). Animals bearing tumors treated with vehicle alone served as controls, *p < 0.05 versus animals treated with Mel alone. Numbers enclosed in parenthesis below each group denotes the number of animals with detectable tumor/total number of animals in the group. Inset – Bioluminescent images of disseminated myeloma tumors growing in bone of animals belonging to the vehicle group (top) and combination group (bottom). Images were taken after 14 days of treatment. (D) Disseminated tumors were established in SCID mice by intravenous injection of HPSE-high cells and after 7 days, animals were sorted into different treatment groups. Tumor burden for all the groups at the end of experiment (5 weeks) was determined by quantification of human kappa immunoglobulin light chain in murine sera using ELISA. Melphalan concentration was 2.5 mg/kg/week in all groups; Roneparstat concentration was 60 mg/kg/day in Group 1 and 120 mg/kg/day in Group 3. #p < 0.05 versus Group 2. Numbers enclosed in parenthesis below each group denotes the number of animals with detectable tumor burden/total number of animals in the group.

