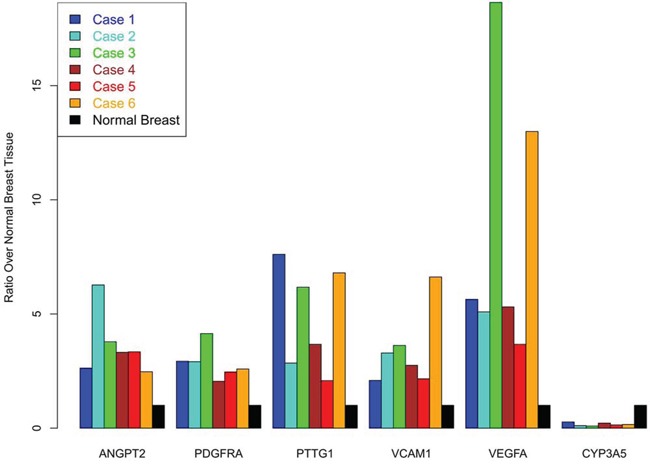
Figure 4. Bar plots for 6 angiogenesis markers found to be differentially regulated in Phyllodes cases when compared to normal breast tissue.

The height represents the ratio of expression for the gene in the phyllodes case over the expression in the normal breast. For CYP3A5, three phyllodes cases had no detectable expression of the transcript and the values are depicted as 0 ratio. Normal breast expression ratio is set to ‘1’ for all 6 biomarkers and is depicted as the ‘black’ bar for all 6 genes.
