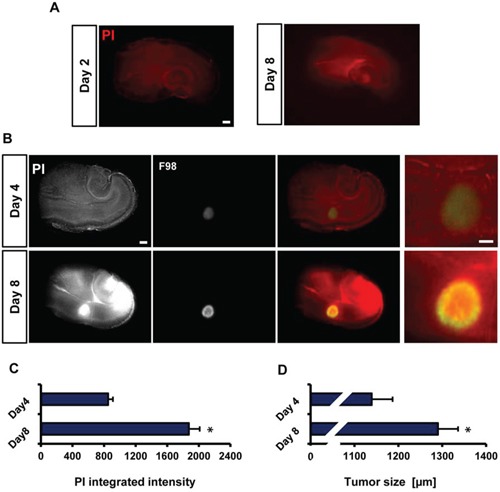
Figure 2. Visualization of tumor growth and cell death in the VOGIM protocol.

A. Representative fluorescence images for PI staining of brain slices to detect cell death after 8 days in culture. Scale bar represents 500 μm. B. Representative fluorescence images monitoring tumor growth (green) and cell death (PI) at day 4 and day 8. Scale bar represents 500 μm. C. Quantification of cell death (PI intensity quantification) at day 4 and 8 (n = 9). D. Quantification of tumor size measurements on day 4 and 8 (n = 9). Scale bar represents 500 μm. Statistical analysis was performed with Student's t-test (*P < 0.05, mean is given ± s.e.m.).
