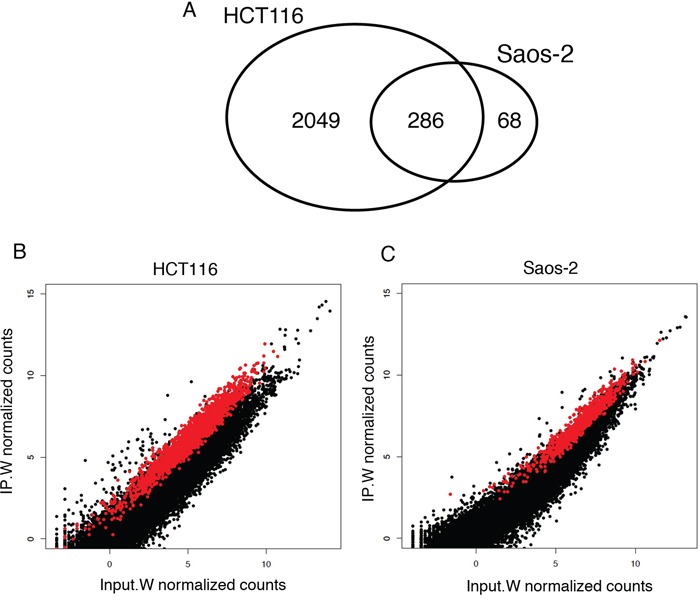
Figure 2. RIP-Seq enrichment analysis identified 286 Wig-1-bound mRNAs common between HCT116 and Saos-2 cells.

A. Venn diagram illustrating the numbers of mRNA identified as Wig-1 RNA targets in both HCT116 and Saos-2 cells, or in only one of the two cell lines. B. and C. Scatterplot of RIP-Seq data from HCT116 (panel B) and Saos-2 (panel C) cells, showing the normalized mean read counts for each transcript detected in the Wig-1 RIP sample (IP.W) plotted against the read count for the same transcript in the Wig-1 input sample (Input.W) (log2 scale). Black dots represent background RNAs (below the 2-fold cutoff, defined as not bound by Wig-1), while the red dots represent enriched RNAs (above the 2-fold cutoff, defined as bound by Wig-1). See materials and methods for details.
