
Figure 4. AU-rich elements in the 3′UTR of Wig-1 target mRNAs.
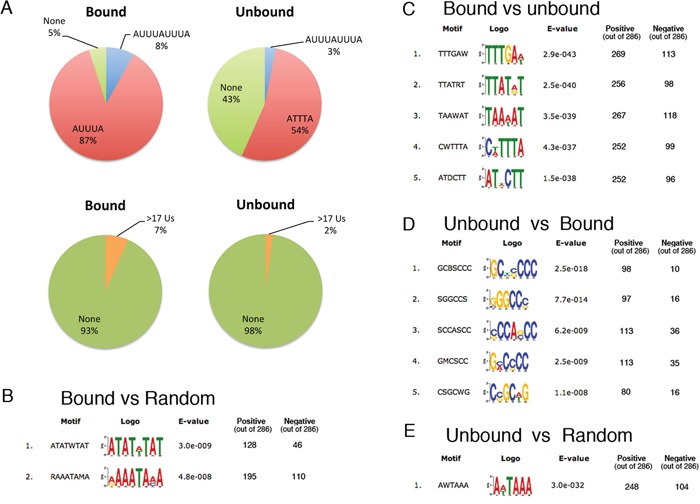
A. Left panel: Circle diagrams showing the percentages of the 3′UTR sequences of the 286 enriched Wig-1 RNA targets (defined as bound, see main text) that contain ARES (determined using RSAT, see materials and methods for details), upper panel, or have stretches of 17 continuous Us or more (lower panel). Right panel: As negative controls, The same analyses were performed on 3′UTRs from 286 RNAs present but not enriched after Wig-1 pulldown (defined as unbound and used as negative controls, see main text). B. RNA motifs enriched in the 286 Wig-1-associated RNAs versus a random control group generated by shuffling the nucleotide sequence of each 3′UTR, determined using Discriminative Motif analysis by DREME (see materials and methods for details). C. Same as in B, but instead of the random group, the group of 286 unbound RNAs (defined in A) was used as control. D. and E. represent controls for the motif analysis: D. show the reverse analysis of C: the Unbound group is compared to the bound group E. The unbound control group is compared to their corresponding shuffled, “random” sequences (similar to B for the bound RNAs).