
Figure 5. Identification of a predicted stem-loop structure within Wig-1-bound mRNAs.
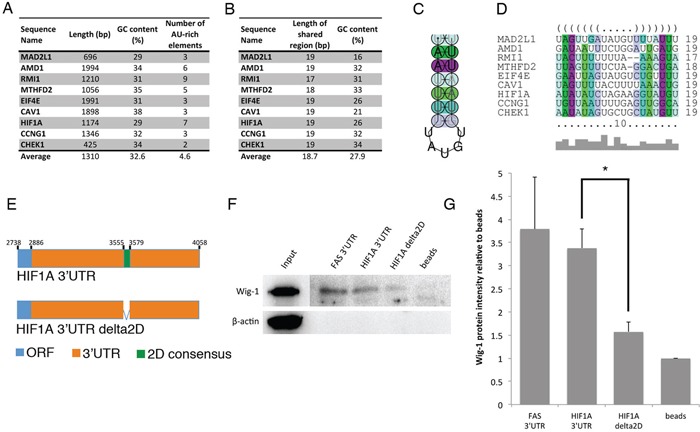
A. The 3′UTR sequences of the nine validated Wig-1-bound mRNAs were compared to identify common features. Length, GC content and ARE element contents of the 3′UTRs are indicated. B. LocARNA software was used to identify a shared structural motif (referred to as the consensus 2D motif) (see materials and methods for details). Length and GC content for the consensus 2D motif from each of the 9 3′UTRs included in the analysis are listed. C. Consensus structure of the consensus 2D motif, predicted by RNAalifold. D. Alignment of the consensus 2D motifs from the 9 3′UTRs included in the analysis shown in dot-bracket notation, where base pairs in the stem loop are indicated by corresponding opening and closing brackets and unpaired nucleotides with dots. Base pairs in C. and D. are colored according to the Vienna RNA conservation coloring scheme [70] where each color represent the number of different base pairs supporting that pair. Red marks pairs have no sequence variation, therefore 100% sequence conservation; yellow, green, turquoise, blue, and violet mark pairs have 2, 3, 4, 5 or 6 different types of pairs, respectively (out of the six possible base pairs: C-G, G-C, A-U, U-A, G-U or U-G). Color saturation indicates structural conservation of the base pair and it decreases with the number of incompatible base pairs. E. Model of the HIF1A constructs used for biotin pulldown (see materials and methods for details). Constructs are not drawn to scale. F. Biotin pull-down assay using the above mentioned probes or a FAS full-length 3′UTR probe as positive control [5] followed by Western blotting for Wig-1 shows that Wig-1 binds to the FAS construct and the HIF1A construct containing the consensus 2D motif, but not to the HIF1A construct lacking the consensus 2D motif. A representative image from one of three independent experiments is shown. G. Wig-1 protein level quantification from three independent experiments using ImageJ densitometry software is shown as mean ± SEM; n = 3; * p-value < 0.05.