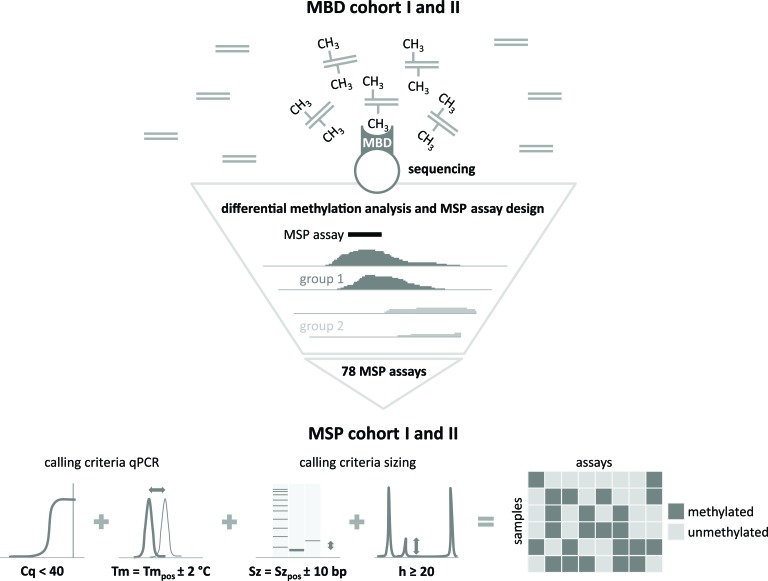
Figure 1. Schematic representation of the study design.
Differentially methylated regions (DMRs) between the prognostic patient groups are identified by methyl-CpG-binding (MBD) sequencing on MBD cohort I and II. For the top candidate prognostic DMRs, the MBD sequencing data were visualized in order to locate the most informative region for methylation-specific PCR (MSP) assay design. These assays were subsequently tested on MSP cohort I and II. By applying specific methylation calling criteria [10], a binary dataset for each of these cohorts was constructed, which was subsequently used for survival analyses. Cq: quantification cycle, Tm: melting temperature; Sz: size; h: height. The subscript pos refers to the data of the positive control sample.

