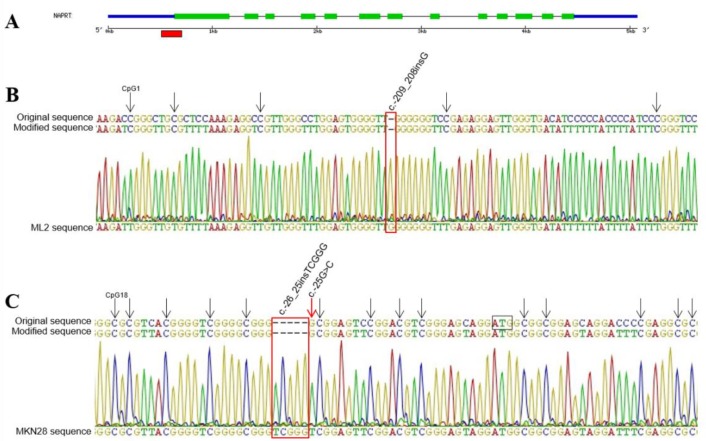
Figure 2. Methylation status of NAPRT promoter region.
A. Schematic representation of the gene structure, with the red box marking the sequenced region within the CpG island. B. Section of the unmethylated ML2 cell line sequencing electropherogram, showing that all cytosines including those in CpG sites (arrows) were converted to thyimines. C. Sequence showing the region surrounding the start codon (ATG) in MKN28 cell line, where all cytosines in GpG sites indicated by arrows are methylated including the additional CpG resultant from rs146163552 insertion. All mutations are indicated in red.

