
Figure 3.
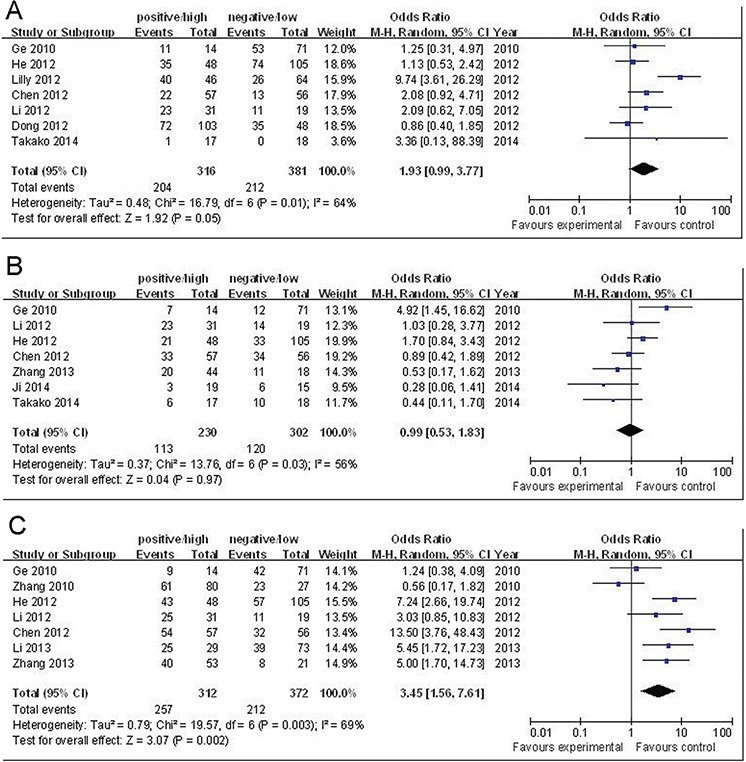
A. Forest plots of Oct-4 and primary tumor (T3-4) in all cases (positive/high Oct-4 vs. negative/low Oct-4). B. Forest plots of Oct-4 and lymph nodes (N1-2) in all cases (positive/high Oct-4 vs. negative/low Oct-4). C. Forest plots of Oct-4 and cancer grade of differentiation (intermediate-poor) in all cases (positive/high Oct-4 vs. negative/low Oct-4). The squares and horizontal lines correspond to the study-specific OR and 95% CI. The area of the squares reflects the weight (inverse of the variance). The diamond represents the summary OR and 95% CI.