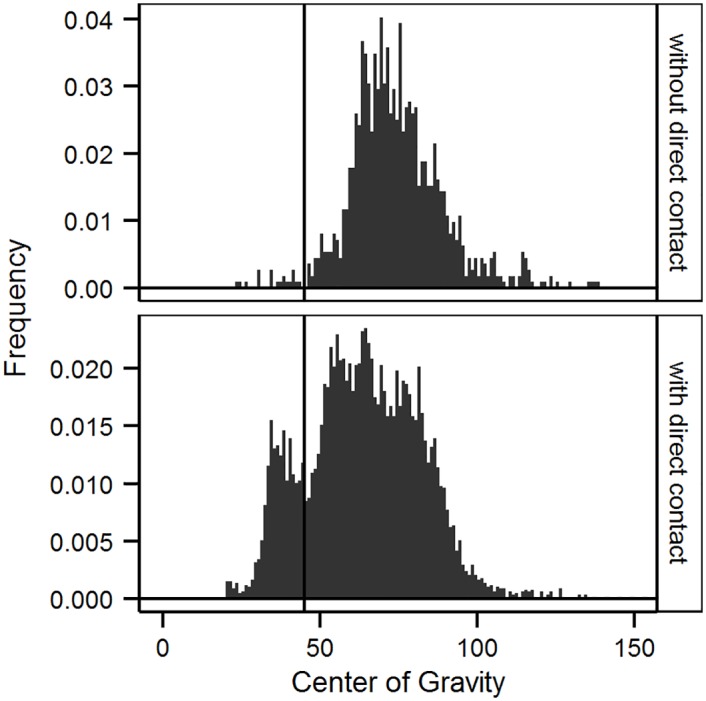
Fig 2. Frequency-distribution of the Center of Gravity of syllable frequency.

Data for night 1 (without direct contact) are shown in the upper panel, data for nights 2–4 (with direct contact) in the lower panel. The vertical line is drawn at 45 kHz and separates low-frequency and high-frequency syllables.
