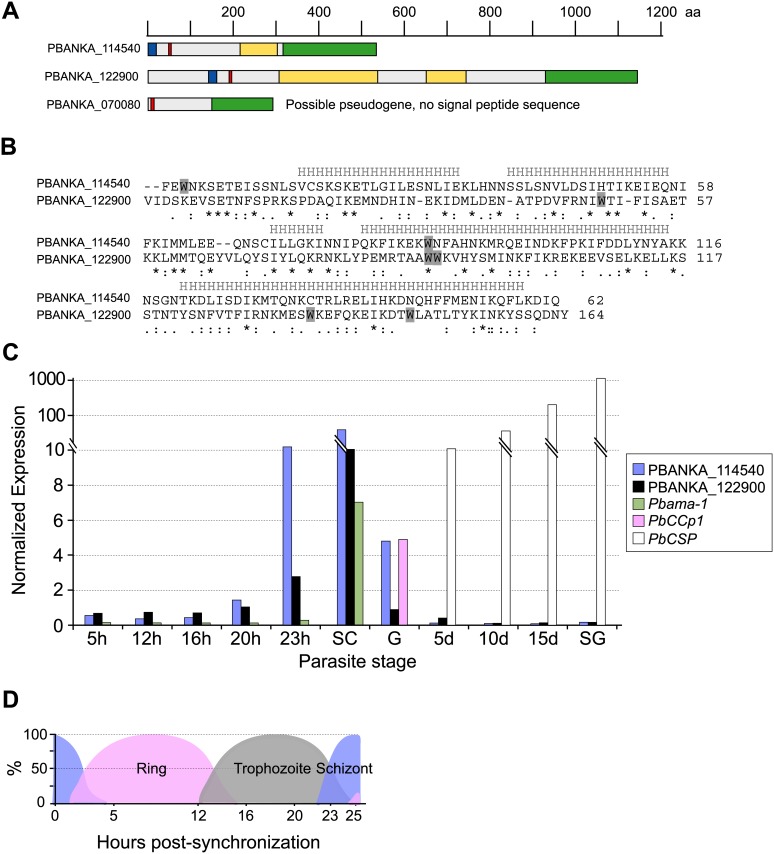
Fig 5. The P. berghei phist genes.
A) Protein domain architectures for P. berghei PHIST-domain encoding genes. The ruler above the architectures indicates protein lengths in aa, drawn to scale. Blue boxes represent the signal sequence; red boxes represent the PEXEL/HT motif; green boxes indicate the PHIST domain; and yellow boxes indicate repeat regions. B) Amino acid sequence alignment of the PHIST domains from PBANKA_114540 and PBANKA_122900. Tryptophan residues are shaded in gray. The predicted helical segments are shown above the alignment, marked by “H”. Below the alignment, stars indicate identical aa residues, 2 dots indicate conserved substitutions and one dot indicates semi-conserved substitutions. C) Transcript expression analysis of the phist genes during the P. berghei life cycle. Transcript levels for PBANKA_114540 and PBANKA_122900 throughout the parasite life cycle was analyzed by real-time quantitative RT-PCR using cDNA that was prepared from synchronized asexual stages, gametocytes and mosquito stage parasites. Transcript expression was normalized to the expression of the control gene hsp70. Pbama-1 was used as a stage-specific control for schizont transcription; PbCCp1 for gametocytes; and PbCSP for oocysts and sporozoites. 5 h, 12 h, 16 h, 20 h and 23 h indicate hours after injecting synchronized schizonts into the tail vein of a mouse. SC, purified schizonts; G, gametocytes; 5 d, 5-day oocysts; 8 d, 8-day oocysts; 10 d, 10-day oocysts; 15 d, 15-day oocysts; SG, salivary gland sporozoites. The composition of the asexual population with respect to life cycle stage is shown for each time point in D), expressed as percentages of the total population.

