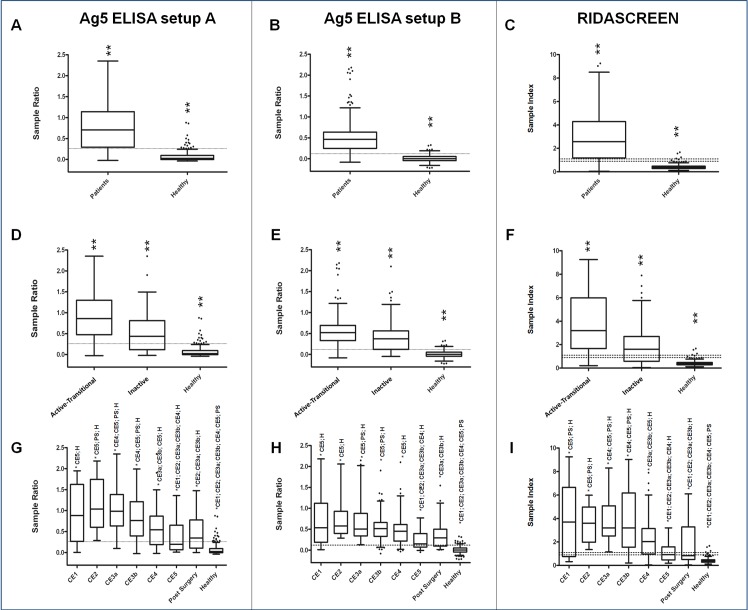
Fig 2.
Box-and-whiskers plots of ELISA results for Ag5 setup A, Ag5 setup B, and RIDASCREEN, (left, middle, and right panels, respectively). Boxes indicate values falling within the 25th and 75th percentiles (InterQuartile Range, IQR). Central lines represent the median values. Whiskers indicate values falling within the ±1.5*IQR. Single dots depict values falling outside the whiskers. Dashed lines indicate the best cut-off values, except for the right panels, where lower and upper limits for borderline values are reported. ** = statistically different groups after Kruskal-Wallis test, or after Conover test, with Bonferroni correction, for multiple comparisons. According to this adjustment, to achieve statistical significance three different p-value have been considered: p <0.05 for panels A, B, and C; p <0.017 for panels D, E, and F; p <0.0018 for panels G, H, and I. Groups significantly different in panels G, H, and I are indicated as (* group). P: patients; PS: post surgery; H: healthy donors.

