
Fig 5. Biochemical analyses of mitochondrial function in TSC2-/- hearts at 4 weeks of age.
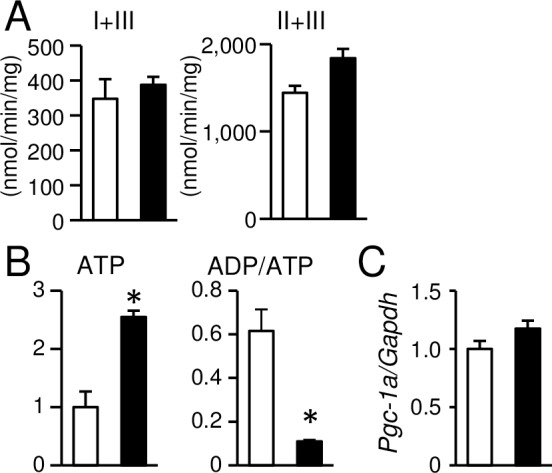
(A): The activities of complex I + III and complex II + III in mitochondria isolated from the hearts. (B): The ATP content expressed as fold increase over levels in the TSC2+/+ group and ADP to ATP ratio (ADP/ATP) in the heart tissues. (C): mRNA expression of Pgc-1a was determined by quantitative RT-PCR. Data were normalized to the Gapdh content and are expressed as fold increase over levels in the TSC2+/+ group. Values represent the mean ± S.E.M. of data from 3–4 mice in each group. Open and closed bars represent TSC2+/+ and TSC2-/- mice, respectively. *P < 0.05 versus corresponding control.