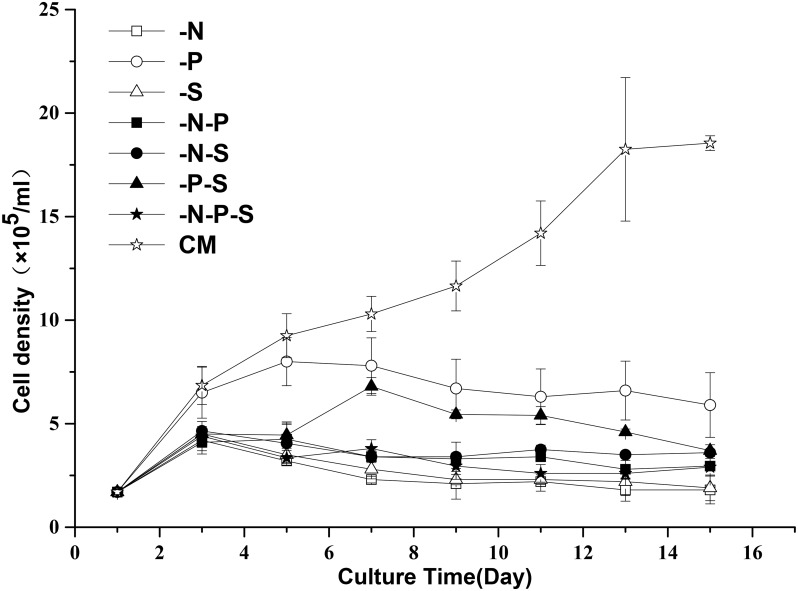
Fig 1. The effects of nutrient deprivation on the cell growth of D. salina.
Cell density was determined for 15 days after exposure to the different treatments. Complete medium (CM), Nitrogen deprivation (-N), Phosphorous deprivation (-P), Sulfur deprivation (-S), Nitrogen and phosphorous deprivation (-N-P), Nitrogen and sulfur deprivation (-N-S), Phosphorous and sulfur deprivation (-P-S), Nitrogen, phosphorous and sulfur deprivation (-N-P-S). The plotted data are the averages ± SE of six replicates.

