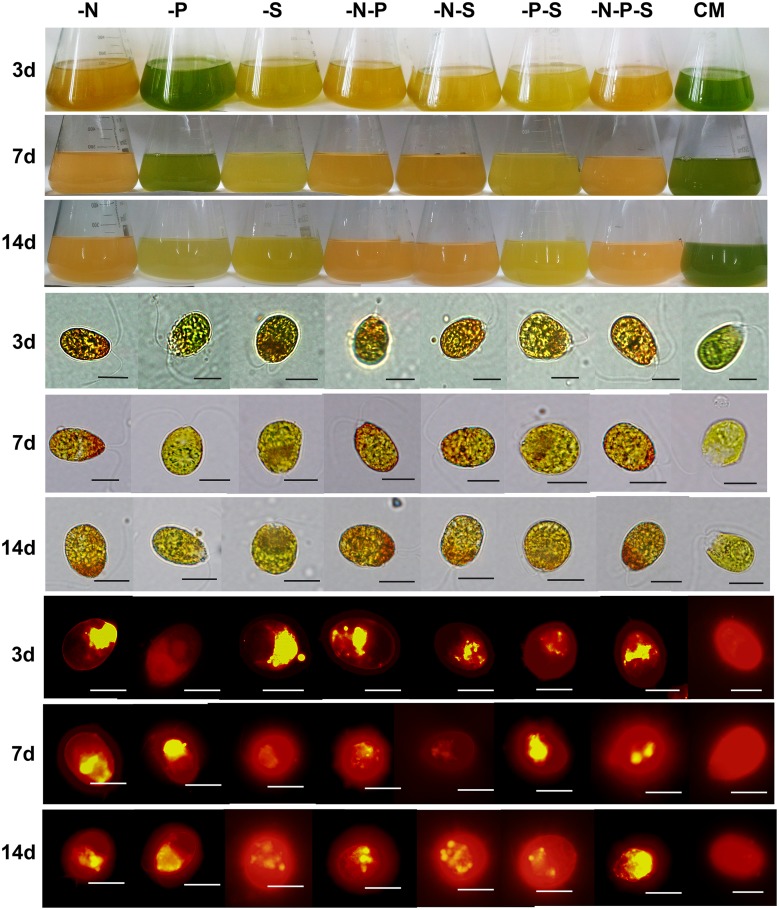
Fig 2. Changes in culture color and the morphology of D. salina cells.
The first three rows of this picture demonstrate that the color of the cultures changed gradually during nutrient deprivation. The middle three rows of this picture demonstrate that the color of the cells changed gradually during nutrient deprivation. The last three rows of this picture show that the lipid globules changed during nutrient deprivation. Complete medium (CM), Nitrogen deprivation (-N), Phosphorous deprivation (-P), Sulfur deprivation (-S), Nitrogen and phosphorous deprivation (-N-P), Nitrogen and sulfur deprivation (-N-S), Phosphorous and sulfur deprivation (-P-S), Nitrogen, phosphorous and sulfur deprivation (-N-P-S). Scale bars, 10 μm.

