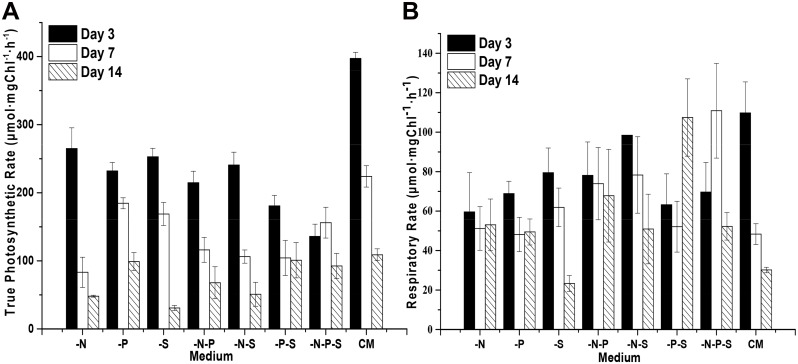
Fig 4. The photosynthetic and respiratory rates of D. salina cells during nutrient deprivation.
The photosynthetic and respiratory rates were calculated based on the amount of oxygen consumed and released by D. salina cells under dark and light conditions, respectively. The true photosynthetic rates (A) show the changes in the amount of oxygen released, and the respiratory rates (B) show the changes in the amount of oxygen consumed. Complete medium (CM), Nitrogen deprivation (-N), Phosphorous deprivation (-P), Sulfur deprivation (-S), Nitrogen and phosphorous deprivation (-N-P), Nitrogen and sulfur deprivation (-N-S), Phosphorous and sulfur deprivation (-P-S), Nitrogen, phosphorous and sulfur deprivation (-N-P-S). The presented data are the averages ± SE of three replicates.

