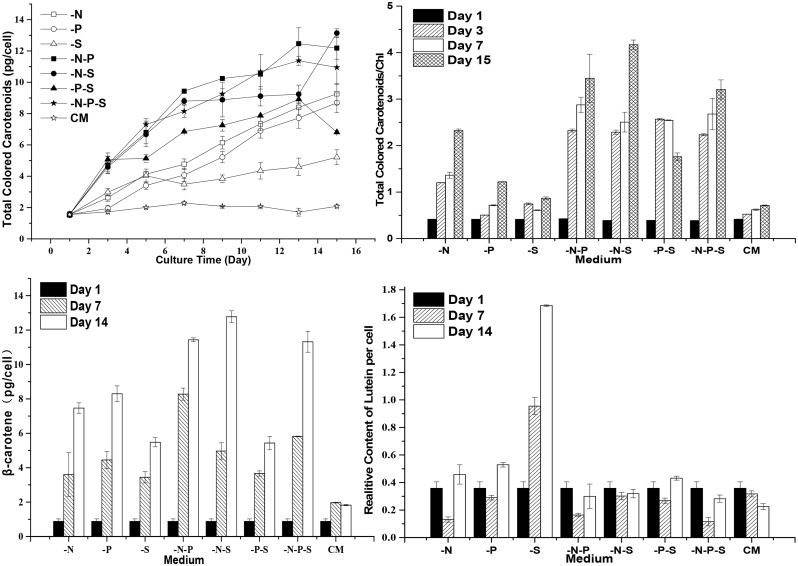
Fig 5. The carotenoid contents of D. salina cells during nutrient deprivation.
The total carotenoid contents (A) were measured using the colorimetric method. The ratio of total colored carotenoids to chlorophyll (B) indirectly reflected the changes in carotenoids and chlorophyll in D. salina cells. The β-carotene contents (C) and the relative contents of lutein (D) were measured via HPLC. Complete medium (CM), Nitrogen deprivation (-N), Phosphorous deprivation (-P), Sulfur deprivation (-S), Nitrogen and phosphorous deprivation (-N-P), Nitrogen and sulfur deprivation (-N-S), Phosphorous and sulfur deprivation (-P-S), Nitrogen, phosphorous and sulfur deprivation (-N-P-S). The presented data are the averages ± SE of three replicates.

