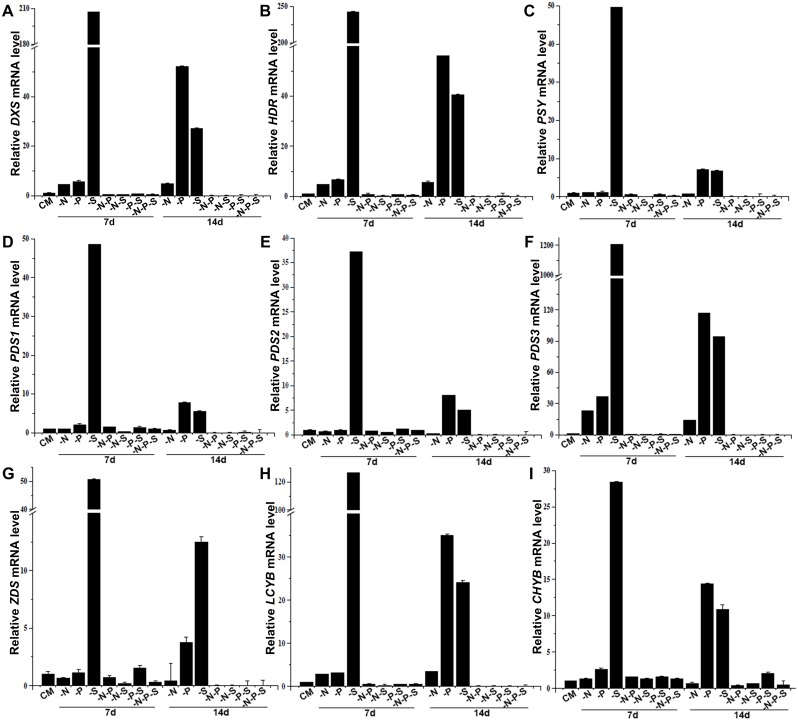
Fig 7. Steady-state mRNA levels of MEP and carotenoid biosynthesis pathway genes in D. salina.
The cultures were subjected to different types of nutrient deprivation. As negative controls for nutrient deprivation, cultures were maintained in complete medium (CM). The samples used for RNA isolation were harvested 7 days and 14 days after exposure to the different treatments. The steady-state mRNA levels of DXS (A), HDR (B), PSY (C), PDS1 (D), PDS2 (E), PDS3 (F), ZDS (G), LCYB (H) and CHYB (I) were quantified via quantitative real-time PCR, normalized against 18S rRNA, and plotted as the relative transcript levels versus time. Gene expressions of cells cultured in CM for seven days were used as control. Nitrogen deprivation (-N), Phosphorous deprivation (-P), Sulfur deprivation (-S), Nitrogen and phosphorous deprivation (-N-P), Nitrogen and sulfur deprivation (-N-S), Phosphorous and sulfur deprivation (-P-S), Nitrogen, phosphorous and sulfur deprivation (-N-P-S). The presented data are the averages ± SE of three replicates.

