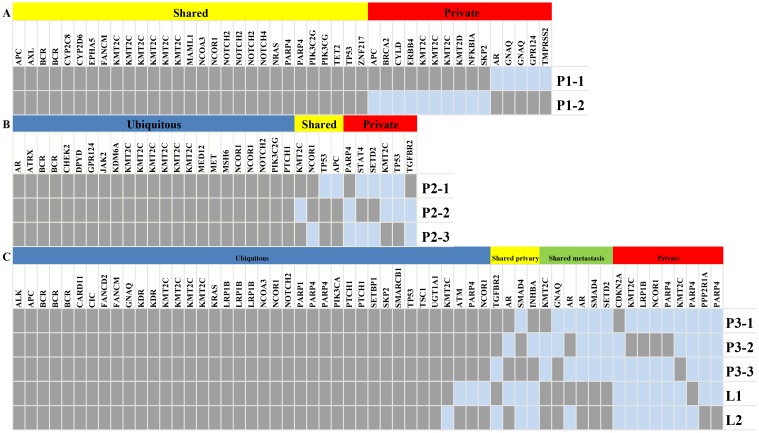
Fig 1. Genetic ITH in three Patient.
A Genetic ITH in Patient 1. The regional distribution of 45 somatic variants in 3 primary tumor regions (P1-1 and P1-2); B Genetic ITH in Patient 2. The regional distribution of 33 somatic variants in 3 primary tumor regions (P2-1, P2-2, and P2-3); C Genetic ITH in Patient 3. The regional distribution of 58 somatic variants in 3 primary and 2 metastatic regions. The heat map indicates the presence (gray) or absence (dark blue) of a mutation in each region. The color bars above the heat map specify the categories of mutations.

