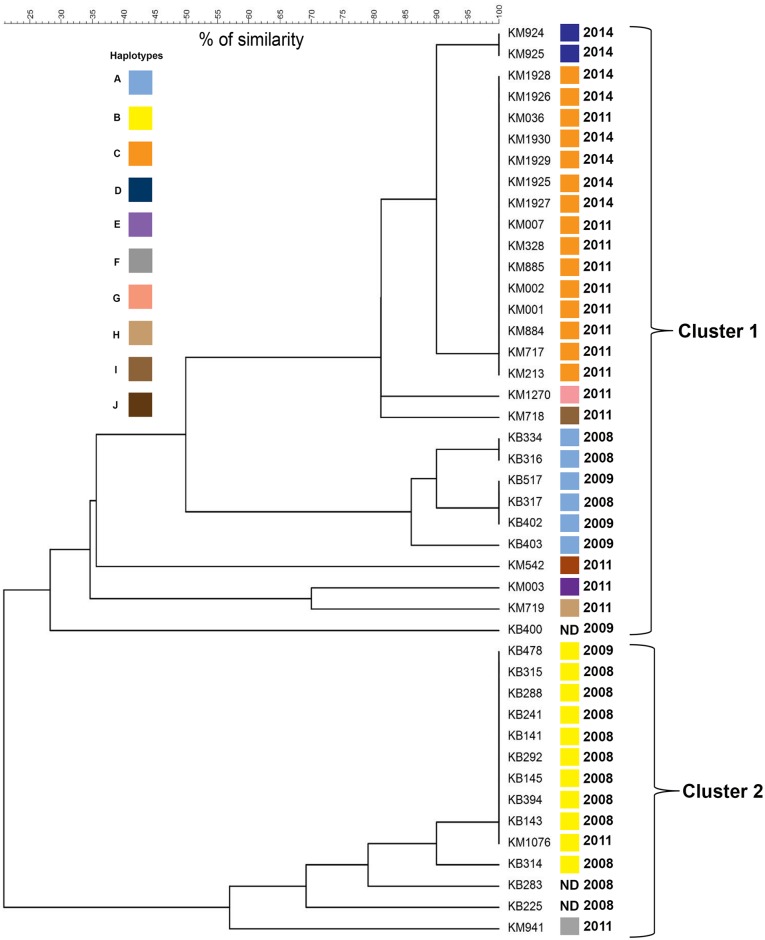
Fig 3. Dendogram showing the clustering of 43 P. falciparum isolates from Kalabakan (KB) and Kota Marudu (KM).
The genetic relatedness between microsatellite haplotypes was examined by generating a similarity matrix based on number of tri-nucleotide repeats of each allele from 10 microsatellite loci to construct an unweighted pair group method with arithmetic mean (UPGMA) dendogram. The color coded haplotypes show the distribution of different clonal P. falciparum isolates within each cluster. The major haplotypes (A, B and C) persisted in every year of sampling (2008 and 2009 for Kalabakan; 2011 and 2012 for Kota Marudu). ND, the haplotype was not determined due to missing genotypes or more than 2 alleles of any microsatellite locus.

