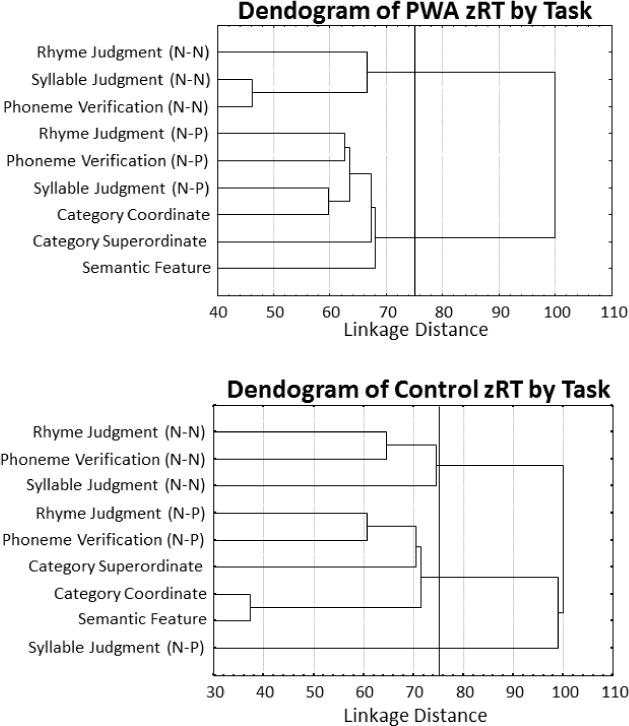
Figure 4.

Dendograms of the hierarchical cluster analyses of zRT within each group. Tasks are clustered along the vertical axis. Standardized linkage distance is plotted along the horizontal axis with the cutoff linkage distance of 75 denoted by a vertical line.
