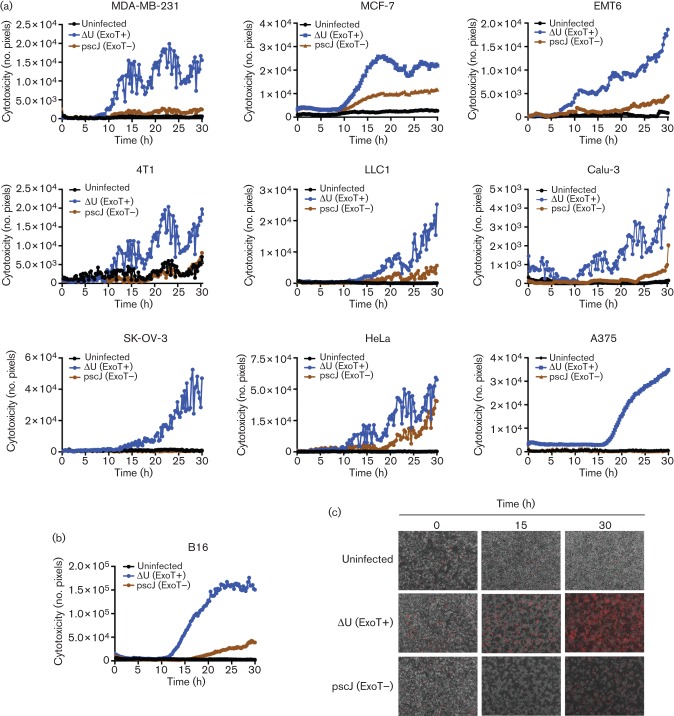
Fig. 2.
Kinetics of ExoT-induced cytotoxicity in cancer cell lines. (a) The indicated cancer cell lines were treated with ExoT-expressing (ΔU) or ExoT-defective (pscJ) P. aeruginosa strains at m.o.i.~10, or left untreated. Cells were observed by time-lapse fluorescence video microscopy in the presence of PI (×100 magnification, 15 min intervals). Cytotoxicity was assessed by total PI uptake at 15 min intervals (cytotoxicity is shown as the mean of three fields of view). (b) Cytotoxicity analysis of B16 melanoma cells as assessed by PI staining (red). (c) Representative frames from B16 time-lapse video microscopy.

