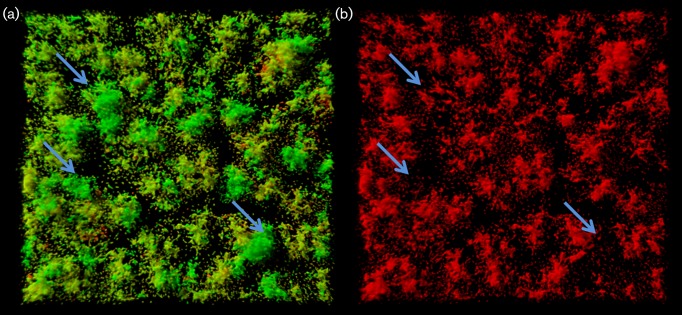
Fig. 7.
CLSM micrographs of biofilms formed by P. fluorescens SBW25 Tn7::gfp2pSEVA237R_PviscA. The images were acquired 3 h after a shift to AB minimal medium with no carbon source. Artificial colours have been assigned in these images to the different CLSM signals; green denotes cells expressing the GFP marker; red denotes cells expressing the viscA-mCherry reporter. (a) GFP and mCherry. (b) mCherry only. Arrows indicate selected microcolonies that are only green and not red.

