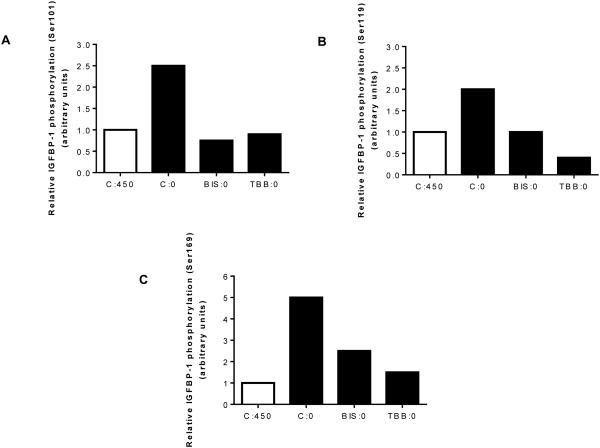
Figure 6. MRM/MS analysis for assessment of IGFBP-1 phosphorylation.
Mass spectrometry analysis of the relative IGFBP-1 phosphorylation induced by leucine deprivation in the presence or absence of TBB or BIS. TBB or BIS attenuate IGFBP-1 phosphorylation at A. Ser101, B. Ser119 and C. Ser169 in the presence of either inhibitor (TBB samples (set to a value of 1) and normalized to a non-phosphorylated peptide within the IGFBP1 protein. C:450 Control, 450 μM leucine. C:0: Leucine deprivation, 0 μM leucine. BIS:0: Bisindolylmaleimide (7.5 μM), 0 μM leucine. TBB:0: TBB (1 μM), 0 μM leucine.

