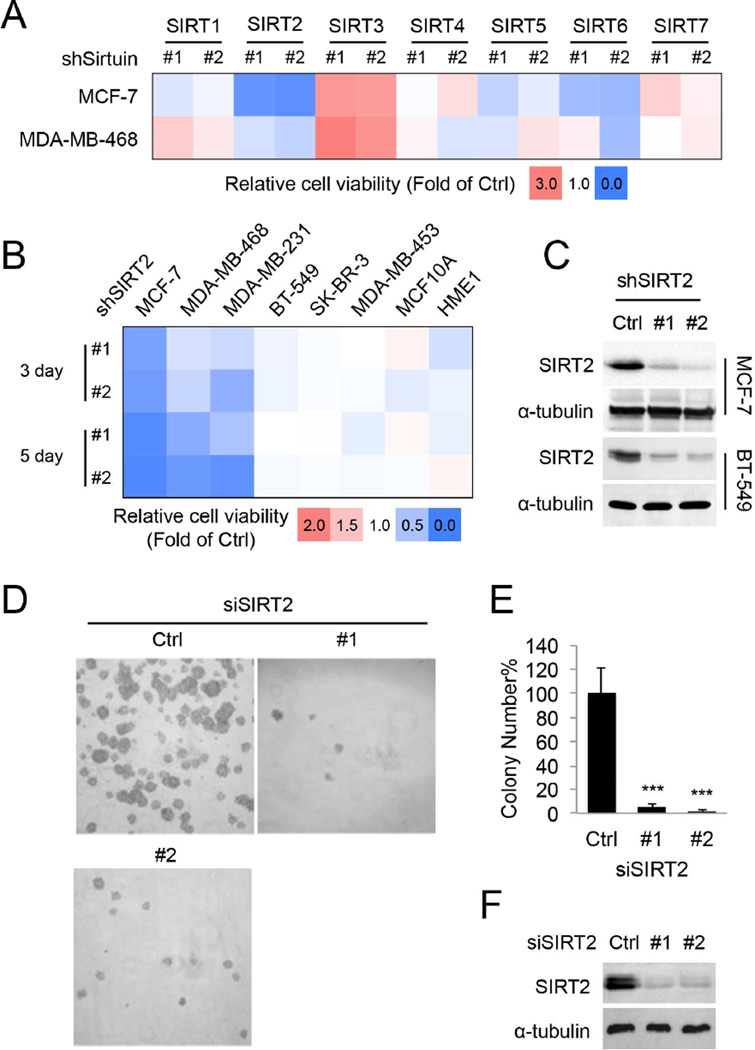
Figure 3.
SIRT2 KD decreases the viability of various cancer cell lines. (A) Cell viability of MCF-7 and MDA-MB-468 cells infected with lentivirus carrying luciferase shRNA (Ctrl) or SIRT1–7 shRNAs for 72 hr. The heat map presents average relative cell viability compared to Ctrl shRNA-infected cells from three independent experiments. (B) Cell viability of various human normal and breast cancer cells infected with lentivirus carrying luciferase (Ctrl) or SIRT2 shRNAs. (C) Representative Western blots showing the knockdown efficiency of SIRT2 in MCF-7 and BT-549 cells. (D) Soft agar colony formation of MCF-7 cells transfected with scrambled siRNA or SIRT2 siRNA. (E) Quantification of the colony numbers in (D). The y axis represents percent colony number relative to scrambled siRNA-transfected cells. Statistics, two-tailed Student’s t-test. (F) Representative Western blots showing the knockdown efficiency of SIRT2 by siRNAs in MCF-7 cells. Error bars represent mean ± sd. ***p < 0.001. See also Figure S3.

