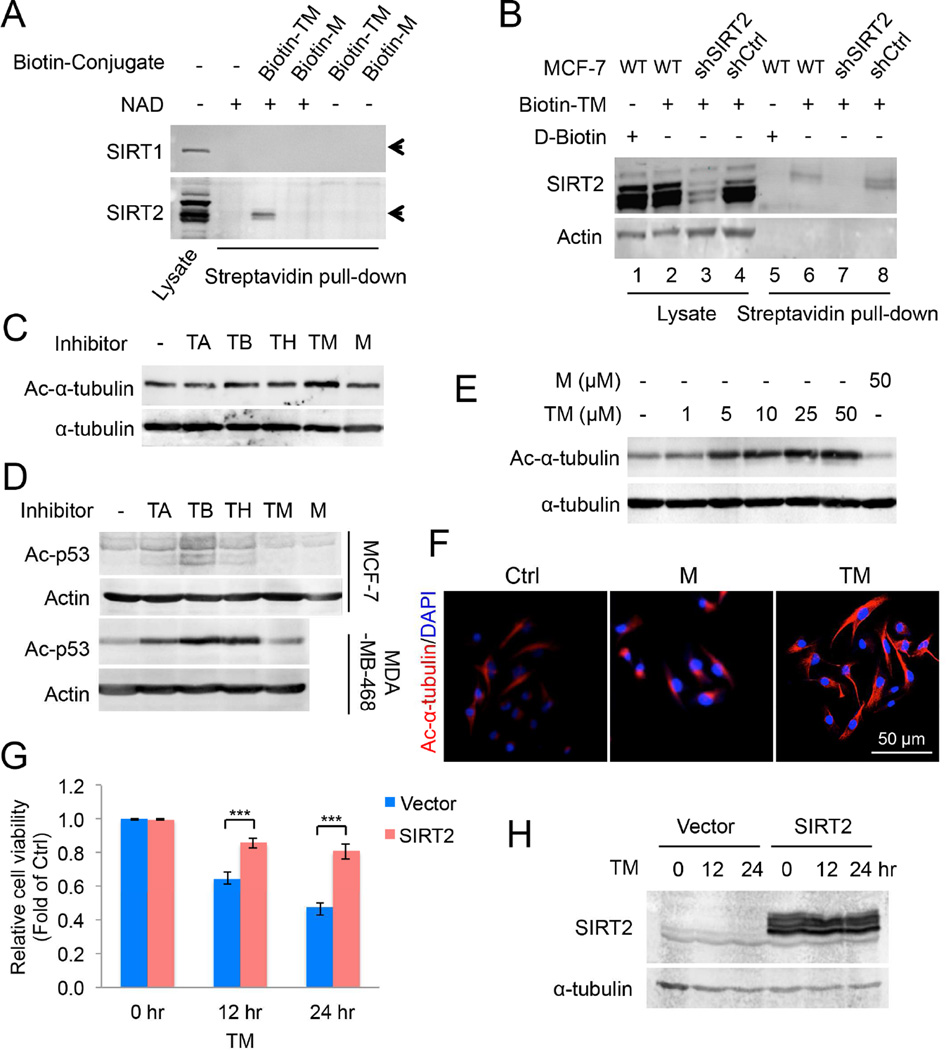
Figure 4.
TM specifically inhibits SIRT2 in cells. (A) Pull-down assay to detect the binding of Biotin-M (10 µM) and Biotin-TM (10 µM) to SIRT1 and SIRT2 in HEK293T total cell lysate. (B) Pull-down assay to detect the binding of Biotin-TM (50 µM) to SIRT2 in MCF-7 cells. D-Biotin (50 µM) was used as a negative control. (C) Immunoblot for the acetyl-α-tubulin (K40) levels in SIRT2-overexpressing MCF-7 cells treated with indicated inhibitors (25 µM) for 6 hr. (D) Immunoblot for the acetylation of p53 (K382) in In MCF-7 or MDA-MB-468 cells treated with TSA (200 nM) and the indicated inhibitors (25 µM) for 6 hr. (E) Immunoblot for acetyl-α-tubulin (K40) levels in MCF-7 cells treated with TM or M for 6 hr. (F) Immunofluorescence detection of the acetyl-α-tubulin (K40) level in MDA-MB-231 cells treated with ethanol, M or TM (25 µM in ethanol) for 6 hr. (G) Effect of SIRT2 overexpression on the cytotoxicity effect of TM. MCF-7 cells were transfected with pCMV vector or pCMV-SIRT2 for 12 hr before being treated with 25 µM of TM for 12 or 24 hr. The y axis represents relative cell viability compared to ethanol-treated controls. Statistics, two-tailed Student’s t-test. (H) SIRT2 overexpression in (G) was confirmed by Western blot. Error bars represent mean ± sd. ***p < 0.001. See also Figure S4.

