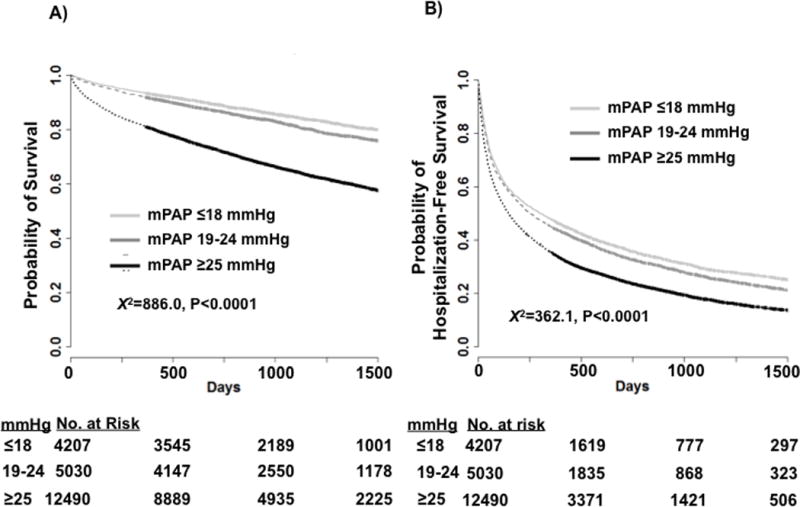
Figure 2.

Time to event plot for unadjusted mortality and hospitalization-free survival for referent, borderline pulmonary hypertension (PH), and PH patients. The study cohort was stratified according to mean pulmonary artery pressure (mPAP) ≤18 mmHg (referent), mPAP=19–24 mmHg (borderline PH), and mPAP ≥25 mmHg (PH), and Kaplan–Meier analysis of the probability of (A) all-cause mortality (log-rank test X2=886.0, P<0.0001) and (B) combined all-cause mortality or hospitalization (log-rank test X2=362.1, P<0.0001) was performed. Censoring begins at and beyond 1 year, and is indicated by thickening of the curve.
