
Figure 2.
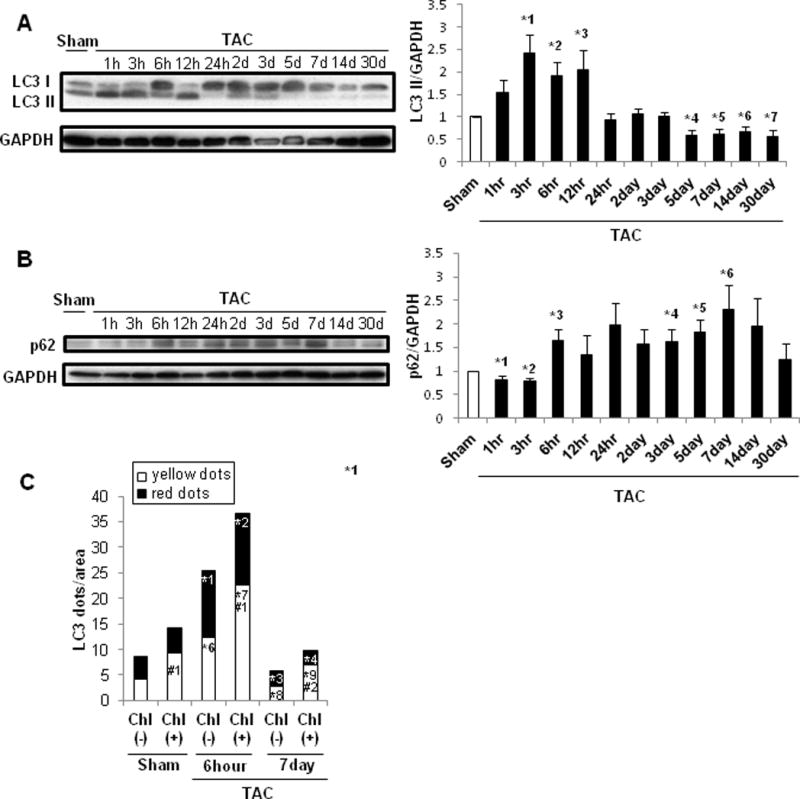
Autophagy was upregulated in the early phase but downregulated in the chronic phase of PO. C57BL/6J mice were subjected to either sham operation (n=43) or TAC for 1, 3, 6, 12 or 24 hours, or 2, 3, 5, 7, 14 or 30 days (n= 4, 4, 4, 4 4, 4, 4, 4, 3, 4, and 4, respectively). A. Representative immunoblots and quantitative analysis of whole-cell heart homogenates for LC3 and GAPDH. * p<0.05 vs. sham-operated mice. *1 p=0.018, *2 p=0.018, *3 p=0.049, *4 p=0.007, *5 p=0.012, *6 p=0.032, *7 p=0.035. B. Representative immunoblots and quantitative analysis of whole-cell heart homogenates for p62 and GAPDH. * p<0.05 vs. sham-operated mice. *1 p=0.043, *2 p=0.015, *3 p=0.032, *4 p=0.044, *5 p=0.016, *6 p=0.031. C. Bar graph indicates mean number of autophagosomes (yellow dots) and autolysosomes (red dots) per cell. Chl: Chloroquine. * p<0.05 vs. sham operation, # p<0.05 vs. Chl (-) at each time point. Data were obtained from 3 experiments. *1 p=0.008, *2 p<0.001, *3 p=0.031, *4 p=0.049, *5 p=0.001, *6 p=0.010, *7 p=0.001, *8 p=0.022, *9 p=0.004,#1 p=0.041,#2 p<0.001.