
Figure 3.
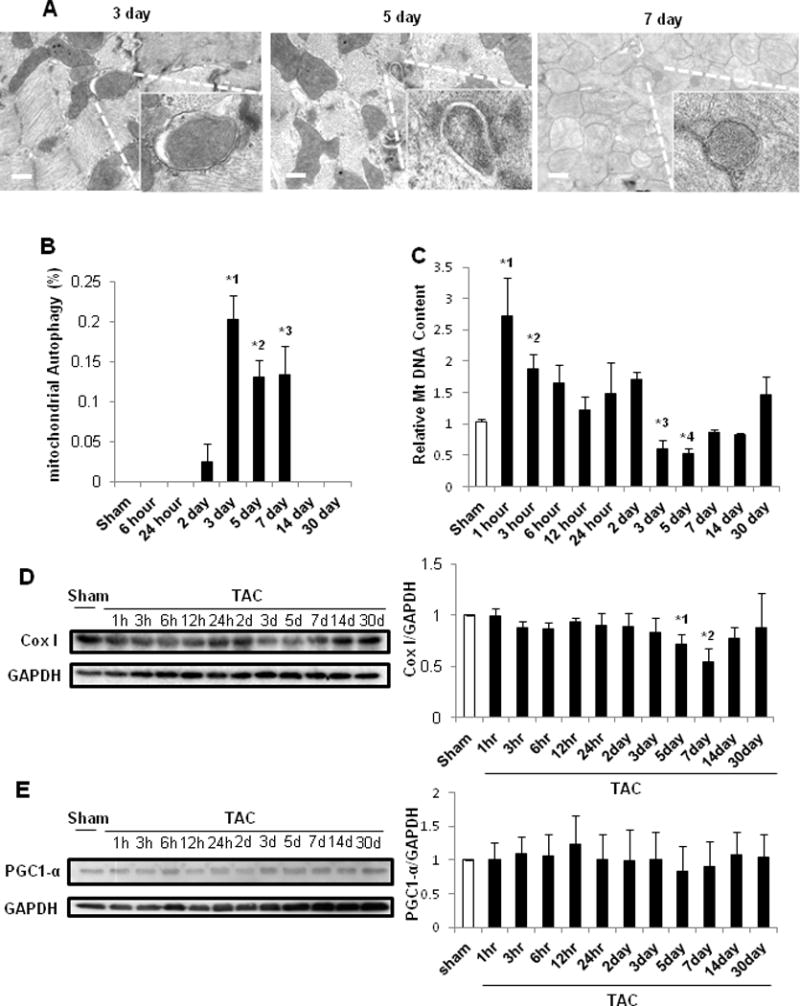
Mitophagy was upregulated 3 days after PO. In A–B, C57BL/6J mouse hearts were examined by EM after sham operation (n=16) or TAC (n=4, 4, 3, and 4 for 6 hours, and 5, 7, and 30 days, respectively). A. Representative EM images of C57BL/6J mouse hearts after TAC. Insets show mitophagy, seen only 3, 5 and 7 days after TAC. Scale bar, 500 nm. B. Bar graphs indicate the number of autophagosomes containing mitochondria per total number of mitochondria. * p<0.05 vs. sham operation. *1 p=0.003, *2 p=0.004, *3 p=0.018. C. Relative mitochondrial DNA content after TAC. C57BL/6J mice were subjected to either sham operation (n=43) or TAC for 1, 3, 6, 12 or 24 hours, or 2, 3, 5, 7, 14 or 30 days (n= 4, 4, 4, 4, 3, 4, 4, 8, 7, 4, and 4, respectively). * p<0.05 vs. sham operation. *1 p=0.025, *2 p=0.044, *3 p=0.040, *4 p=0.043. In D–E, C57BL/6J mice were subjected to either sham operation (n=4) or TAC for 1, 3, 6, 12 or 24 hours, or 2, 3, 5, 7, 14 or 30 days (n= 4, 4, 4, 4, 4, 4, 4, 4, 3, 4, and 4, respectively). D. Representative immunoblots and quantitative analysis of whole-cell heart homogenates for Cox I and GAPDH. * p<0.05 vs. sham operation. *1 p=0.030, *2 p=0.015. E. Representative immunoblots and quantitative analysis of whole-cell heart homogenates for PCG1α and GAPDH.