
Figure 5.
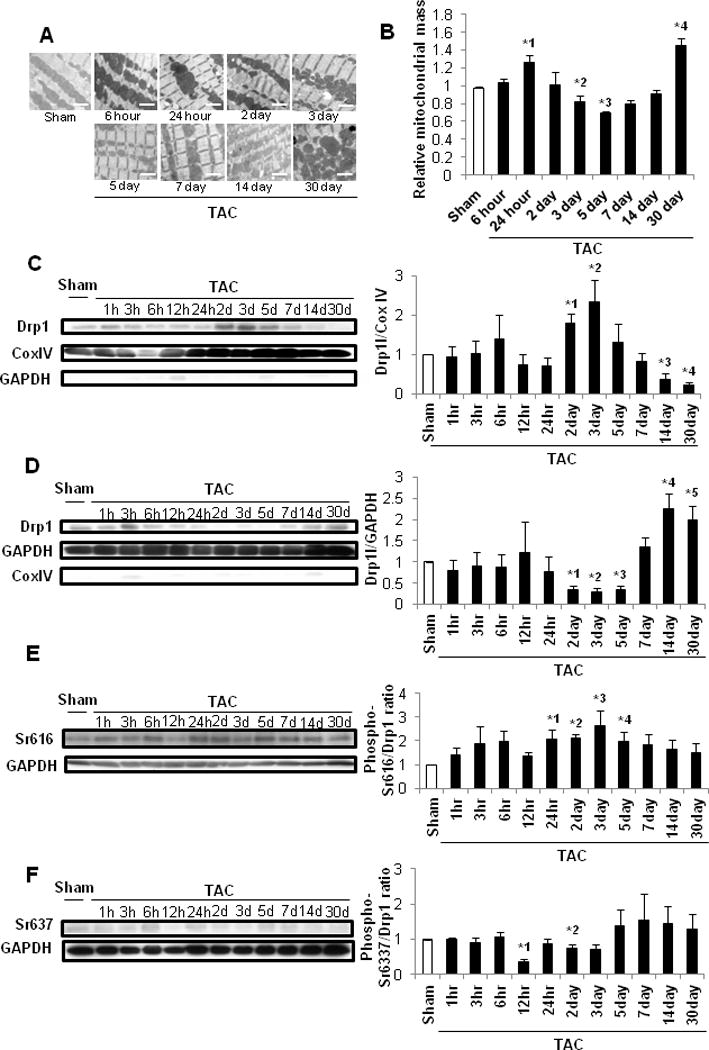
Mitochondrial morphology and mitochondrial translocation of Drp1 after PO. In A–B, C57BL/6J mice were subjected to either sham operation (n =32) or TAC for 1, 3, 6, 12 or 24 hours, or 2, 3, 5, 7, 14 or 30 days (n= 4, 4, 4, 4, 4, 4, 4, 4, 3, 4, and 4, respectively). A. EM images of C57BL/6J mouse hearts after TAC. Scale bar, 2 μm. B. Mitochondrial mass in control mouse hearts is expressed as 1. * p<0.05 vs. sham at each time point. *1 p=0.048, *2 p=0.047, *3 p=0.027, *4 p=0.010. In C–F, C57BL/6J mice were subjected to either sham operation (n =4) or TAC for 1, 3, 6, 12 or 24 hours, or 2, 3, 5, 7, 14 or 30 days (n= 4, 4, 4, 4, 4, 4, 4, 4, 3, 4, and 4, respectively). C. Representative immunoblots and quantitative analysis of Drp1, GAPDH and Cox IV in the mitochondrial fraction prepared from heart homogenates. * p<0.05 vs. sham. *1 p=0.013, *2 p=0.040, *3 p=0.007, *4 p<0.001. D. Representative immunoblots and quantitative analysis of Drp1, GAPDH and Cox IV in the cytosolic fraction prepared from heart homogenates. *1 p<0.001, *2 p<0.001, *3 p<0.001, *4 p=0.013, *5 p=0.023. In E–F, whole-cell heart homogenates were subjected to immunoblot analyses. Representative immunoblots and quantitative analyses are shown. E. Drp1 Ser616 phosphorylation. *1 p=0.026, *2 p=0.001, *3 p=0.048, *4 p=0.049. F. Drp1 Ser637 phosphorylation. *1 p<0.001, *2 p=0.049.