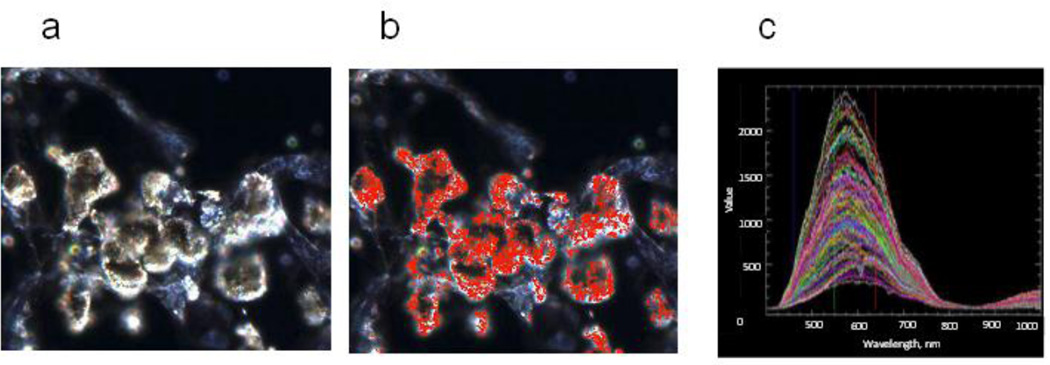
Fig. 9.
Hyperspectral images (CytoViva) of the lung tissue of mice at day 7 after pharyngeal aspiration of SWCNTs. The scanned images a) were collected at 40 × employing an Olympus BX-51 microscope and a 100 W quartz-halogen light source. The pixels that match the SWCNTs spectral profiles were mapped in red b). Spectral data c) was captured with the CytoViva spectrophotometer utilizing an integrated CCD camera.

