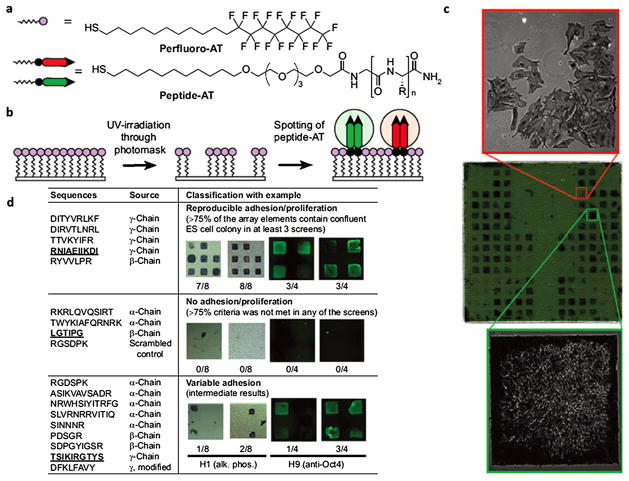
Fig. 3.
SAM surface array screen for ES cell growth and self-renewal. (a) Structure of alkanethiols used for the assembly of the array. “R” denotes amino acid side chains. (b) A two-step process was used to generate the arrays. A uniform SAM composed of perfluoro-AT was photopatterned and solutions of peptide-ATs were spotted onto the exposed gold areas to form peptide-terminated SAM array elements. (c) A representative array containing 18 different peptide-ATs was screened to identify surfaces that promote proliferation of ES cell line H9. The peptide-displaying SAMs are arranged in a mirror-symmetric pattern (bottom and top halves of chip have identical array elements). Each half of the array contains 18 laminin-derived peptide-ATs spotted in groups of four (2 × 2 elements) arranged in a left-to-right horizontal comb pattern. The remaining array elements are filled with nonadhesive glucamine-AT. The array was incubated with media containing 20% FBS and thoroughly washed with serum-free media. Cells were grown on the array for 6 d in culture media, fixed, and stained for alkaline phosphatase (AP). The positions of cell growth are symmetric and emphasize the reproducibility of ES cell responses to the array elements. The array was mounted onto a glass slide and scanned using a flatbed scanner. The phase-contrast 10× images reveal morphological differences between AP-positive undifferentiated (left) and AP-negative differentiated ES cells (right). Array dimensions: 22 × 22 mm; each element is 0.8 mm. (d) Summary of results from multiple screens for 18 laminin-derived peptides and ES cell lines H1 and H9. Laminin chain origin is shown for each peptide. Following 5–7 d of growth, substrates were categorized according to their ability to accommodate confluent (square-shaped) and undifferentiated colonies, as judged by staining for alkaline phosphatase (purple) or Oct4 (green). Each synthetic substrate was tested four to eight times in each screen; therefore, the fraction of array elements presenting square ES cell colonies serves as a convenient measure of substrate efficiency. Representative results for one peptide in each category are shown, and the corresponding peptide sequences are underlined. The apparent higher intensity of Oct4 around the edges of the array element can be attributed to differences in thicknesses of ES cell colony around the edges or differentiation of overcrowded cells in the middle of the array element. The latter is not observed when cells are cultured on large area substrates that do not restrict colony growth. (Figure from Ref. [72] with permission).

