Fig. 4.
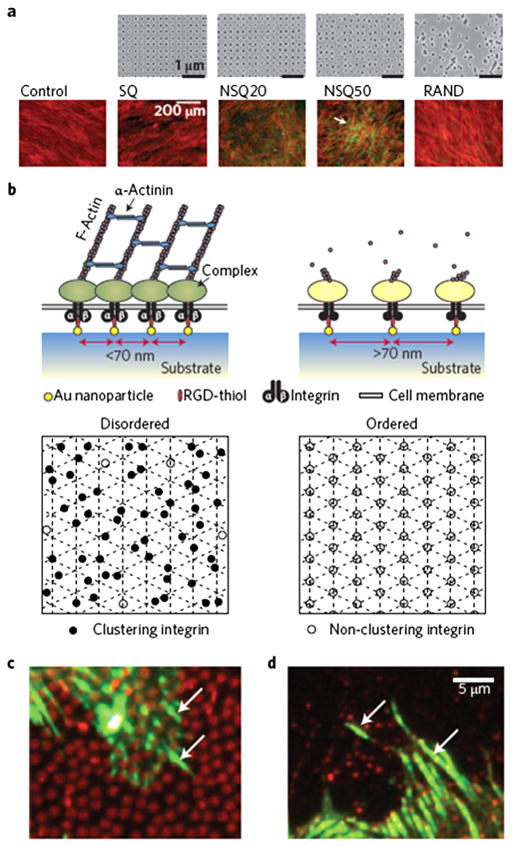
Nanoscale disorder and adhesion bridging. (a) Electron-beam lithography was used to demonstrate that neither order nor randomness successfully led to osteoinduction of MSCs. SQ, square (within the square array the individual pits are 120 nm in diameter, 100-nm deep and have a 300-nm centre–centre spacing); RAND, random. However, controlled disorder (NSQ20 and NSQ50, same as SQ but with ±20 nm and ±50 nm offset from the 300 nm centre–centre position) produced abundant, spontaneous, osteogenesis in basal media. Cells are shown in red (actin) and osteogenesis is shown in green (osteopontin). (b) At the adhesion level, adding a level of disorder to RGDs placed 70 nm apart allowed much greater integrin clustering in MSCs. Bottom panels show an ordered lattice (right) with RGDs placed >70 nm apart with little integrin clustering possible (open circles). However, if a level of disorder (left) is added while there are areas with gaps where adhesion does not occur, more RGDs are moved within gathering distance (closed circles). (c and d) Fluorescence microscopy images showing 800-nm-diameter fibronectin circles (red, c) and 200-nm-diameter vitronectin circles (red, d) with adhesions (vinculin in green) seen bridging between the circles (arrows). (Figure from Ref. [42] with permission). (For interpretation of the references to color in this figure legend, the reader is referred to the web version of this article.)

