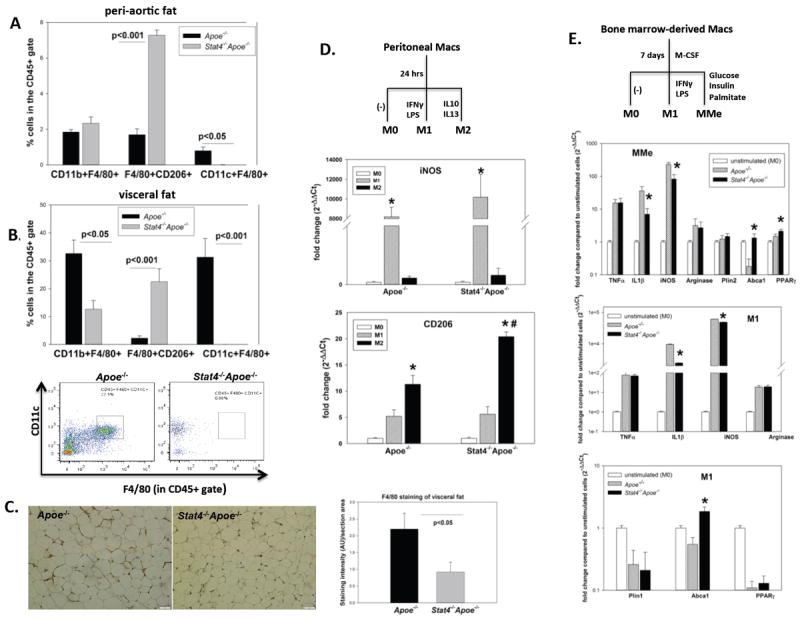
Figure 2. Effect of STAT4 deficiency on macrophage abundance, polarization and inflammatory profile.

Relative composition of macrophages in peri-aortic fat (A) and visceral fat (B) of mice on western diet (n=5-7); representative FACS plots for CD11c+F4/80+ are also shown. (C): representative micrographs and quantitation of F4/80 staining in visceral adipose tissue of Stat4-/-Apoe-/- and Apoe-/- mice on western diet (n=4/group); AU=arbitrary units. (D): M1 and M2 macrophage marker gene expression in peritoneal macrophages were measured by real-time PCR and expressed as fold change compared to unstimulated macrophages (M0); n=3 independent experiments performed in duplicate; * = significantly different compared to M1/M2 and M0; # = significantly different compared to Apoe-/- group. (E): M1 and MMe (metabolically activated) markers were measured in bone marrow derived macrophages by real-time PCR; results represent mean ±SEM from n=4 independent experiments performed in duplicate; * = significant compared to Apoe-/- group. Statistical analysis for (D) and (E) was performed using One-way ANOVA.
