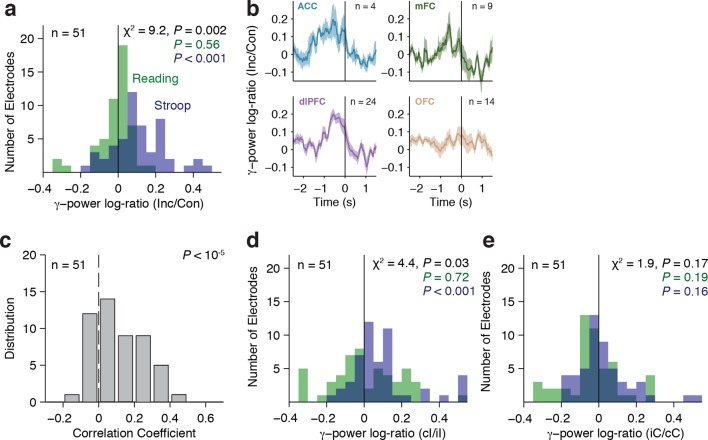
Figure 4. Gamma power in frontal cortex correlates with behavior.
(A) Distribution of gamma power log-ratio (Incongruent/Congruent) for the Stroop task (blue) and Reading task (green). Bin size = 0.05. Gamma power showed a significant interaction between Congruency and Task (P = 0.002, multilevel model, Materials and methods). Power was larger for incongruent versus congruent trials during the Stroop task (P < 0.001, n = 51 frontal cortex electrodes) but not during the Reading task (green, P = 0.56). The statistical analyses directly compare the gamma power, we show the log-ratios here for display purposes only. (B) Normalized gamma power log-ratio averaged across electrodes from each of the four different frontal cortex regions during the Stroop task. We divided the power during incongruent trials by the power during congruent trials, then computed the log and finally averaged across electrodes. Data are aligned to the behavioral response onset (t=0). (C) Distribution of Pearson correlation coefficients between the maximal gamma power and behavioral reaction time during incongruent trials for n = 51 frontal cortex electrodes. These correlations were significantly positive (P < 10–5, sign-rank test). Bin size = 0.1. (D) For incongruent trials, there was a significant interaction between trial history and task (P = 0.03, multilevel model). Gamma power was larger for incongruent trials preceded by congruent trials (cI) compared to incongruent trials preceded by incongruent trials (iI), particularly during the Stroop task (blue, P = 0.001), compared to the Reading task (green, P = 0.72). Data beyond the range of the x-axis are shown in the first or last bins. (E) For congruent trials, there was no interaction between trial history and task (P = 0.17, multilevel model). Gamma power was similar in congruent trials preceded by incongruent trials (iC) compared to congruent trials preceded by congruent trials (cC) during the Stroop task (blue, P = 0.16) and during the Reading task (green, P = 0.19).
DOI: http://dx.doi.org/10.7554/eLife.12352.012
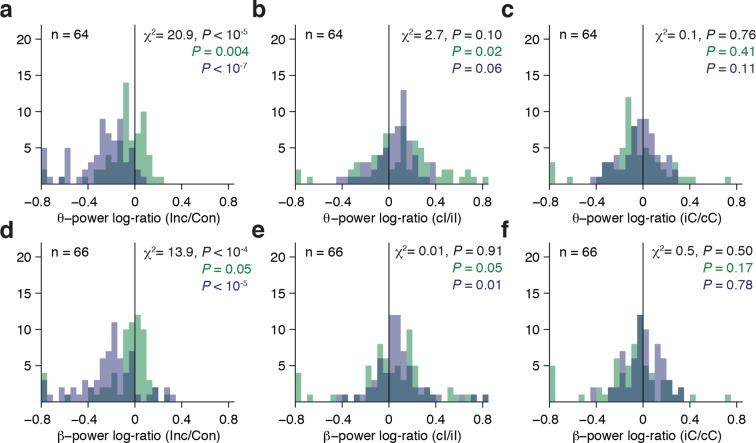
Figure 4—figure supplement 1. Theta and Beta band population results.
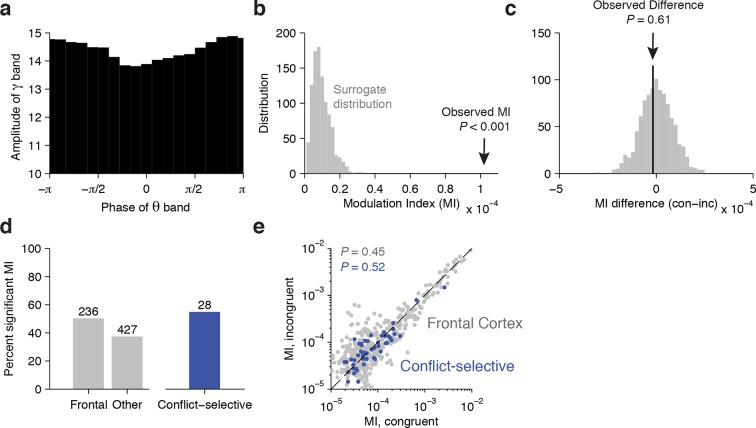
Figure 4—figure supplement 2. Cross-frequency coupling analyses.
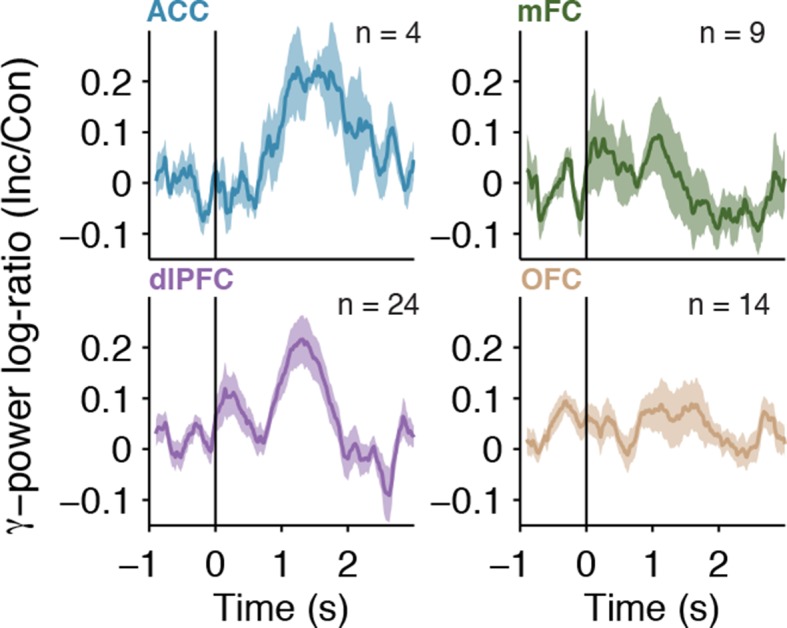
Figure 4—figure supplement 3. Stimulus-aligned population averages.


