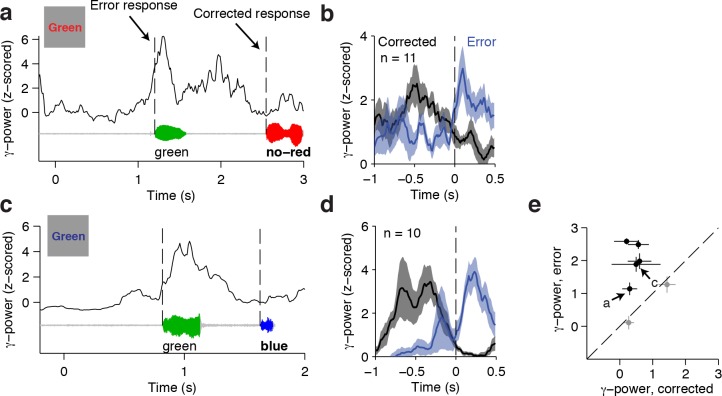
Figure 5. Responses during self-corrected error trials.
(A) An example self-correction trial from the ACC electrode in Figure 2 when the word Green colored in red was presented. The single trial gamma power is shown on top, with the speech waveform below. The dashed lines indicate the onset of the initially incorrect response ('green') and the following corrected response in bold ('no – red'). Note the increased gamma power after an error response. (B) Average gamma power aligned to the onset of the initial error response (blue) and the onset of the corrected response (black) for n = 11 self-correction trials. Shaded areas indicate s.e.m. The post-response power was significantly greater after the error (P = 0.001, signed-rank test). (C-D) Same as (A-B) for another example electrode in the dorsolateral prefrontal cortex. The post-response power was significantly greater after the error response (P = 0.002, signed-rank test). (E) Across the n = 7 electrodes with n = 10 or greater self-correction trials, the z-scored gamma power during the initial error response was larger than during the corrected response. Electrodes with significant differences (P < 0.05, signed-rank test) are colored black. Letters mark the examples in (A) and (C).
DOI: http://dx.doi.org/10.7554/eLife.12352.017

