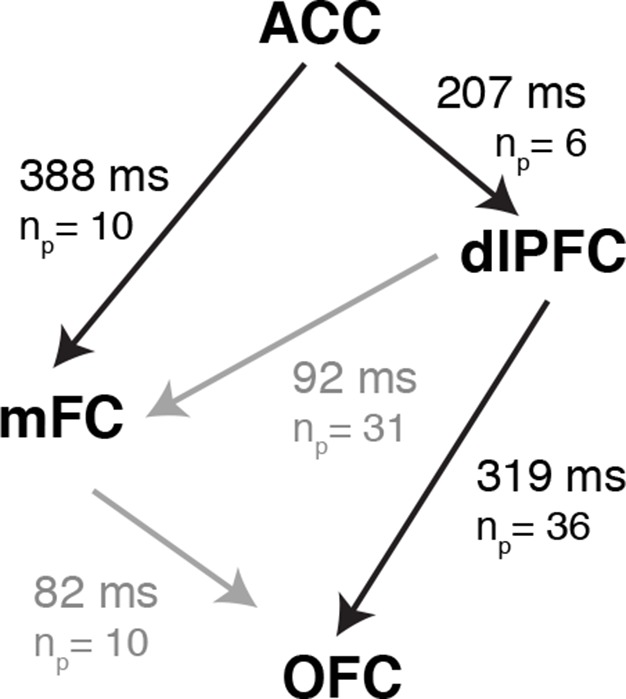
Figure 6. Latency Comparisons across regions.

Latency differences between different regions computed from all pairs of simultaneously recorded electrodes. np denotes the number of electrode pairs. Because we only consider simultaneously recorded electrodes here, not all the electrodes modulated by conflict can be paired with any other electrode. Supplementary file 3 shows the number of electrodes modulated by conflict in each area and subject. There was only one electrode pair between ACC and OFC and therefore we do not show the latency difference between these two regions here. Significant latency differences (P < 0.05, permutation test, Materials and methods) are shown in black, and non-significant differences in gray. ACC leads both mFC (P = 0.001) and dlPFC (P = 0.02), with OFC following dlPFC (P = 0.009).
DOI: http://dx.doi.org/10.7554/eLife.12352.019
