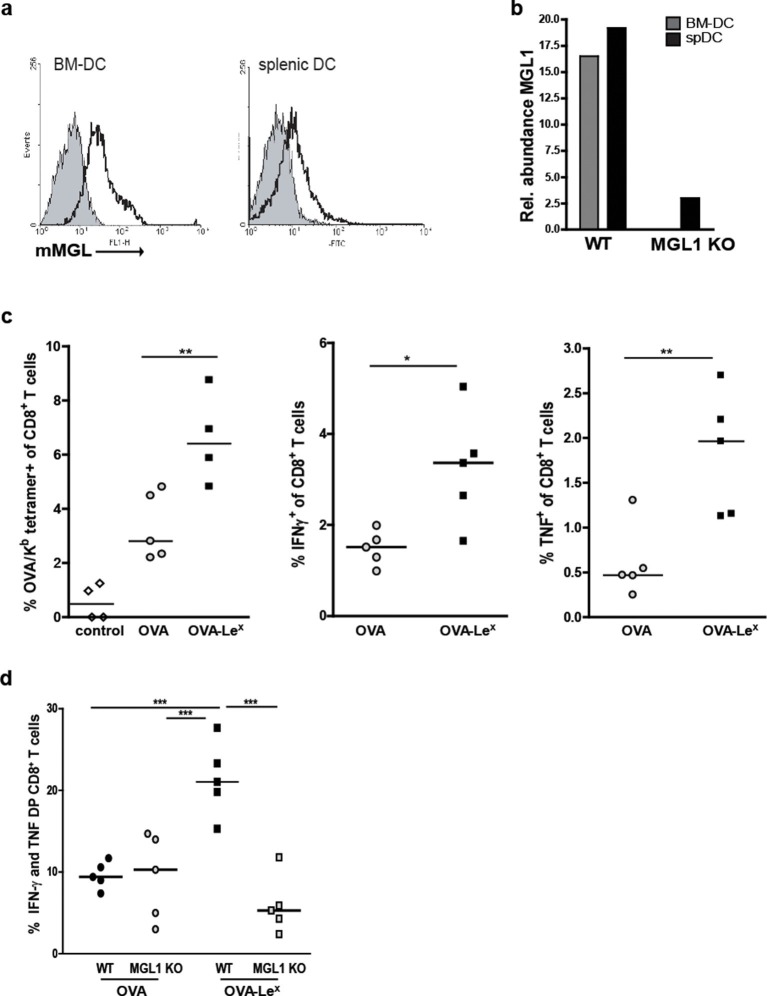
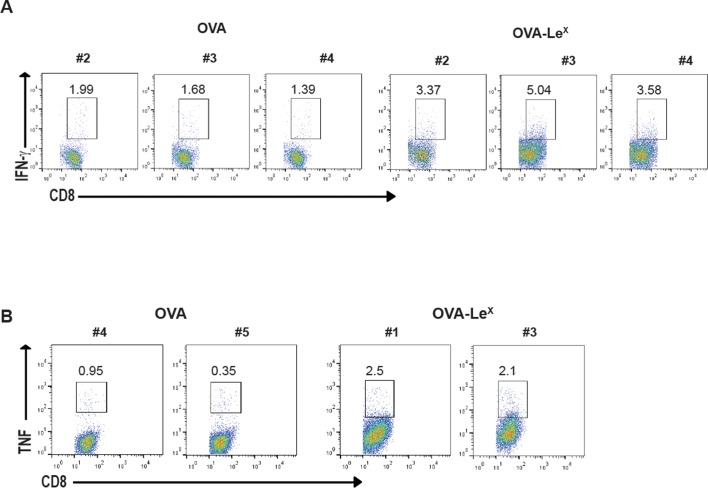
Figure 2. Immunization with OVA-LeX induces increased CD8+ T cell responses in vivo.
(A) Expression of murine MGL on BM-DCs and CD11c+ spDCs was analyzed by flow cytometry. (B) MGL1 mRNA expression by BM-DC and splenic DC from WT and MGL1 KO mice was determined using qRT-PCR. GAPDH was used as a reference gene and the results are representative of three independent experiments. C57BL/6 mice were immunized s.c. with either OVA-LeX or native OVA mixed with anti-CD40 using a prime-boost protocol. Spleens were analyzed by flow cytometry to determine the frequency of (C) H2-Kb/SIINFEKL-tetramer-binding CD8+ T cells and IFN-γ or TNF production by activated CD8+ T cells was determined by intracellular staining after OVA-specific re-stimulation ex vivo. Dots represent individual mice (n=4–5 mice/group; **p<0.01). Bars indicate median of each group. Graphs shown are representative of two independent experiments. (D) C57BL/6 and MGL1 KO mice were prime-boosted with either OVA-LeX or native OVA mixed with anti-CD40. Frequencies of IFN-γ and TNF-double-producing CD8+ T cells were determined by intracellular staining after OVA-specific re-stimulation of splenocytes ex vivo. Dots represent individual mice (n=4–5 mice/group; *p<0.05 ***p<0.001). Bars indicate median of each group. Data are representative of 2 independent experiments.


