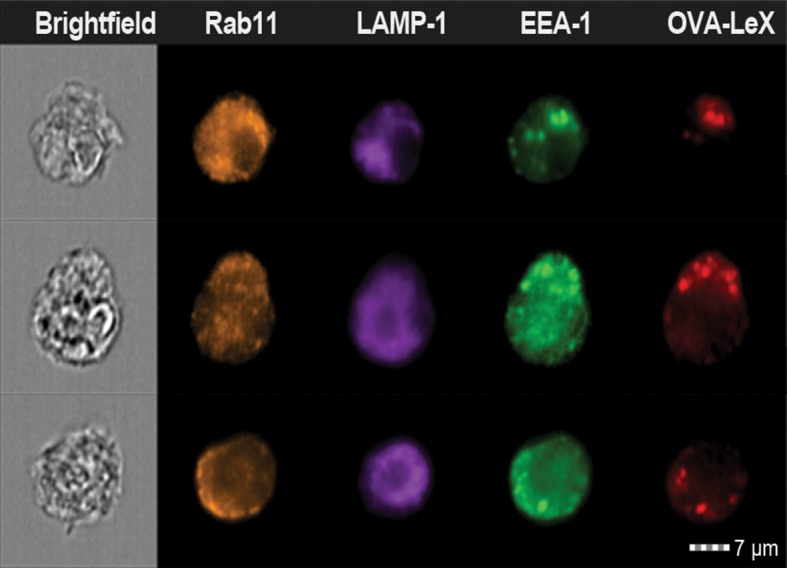
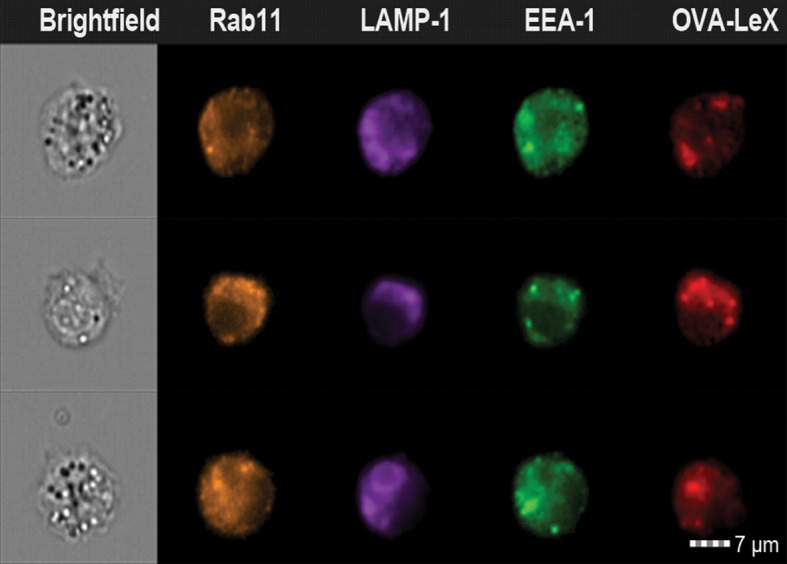
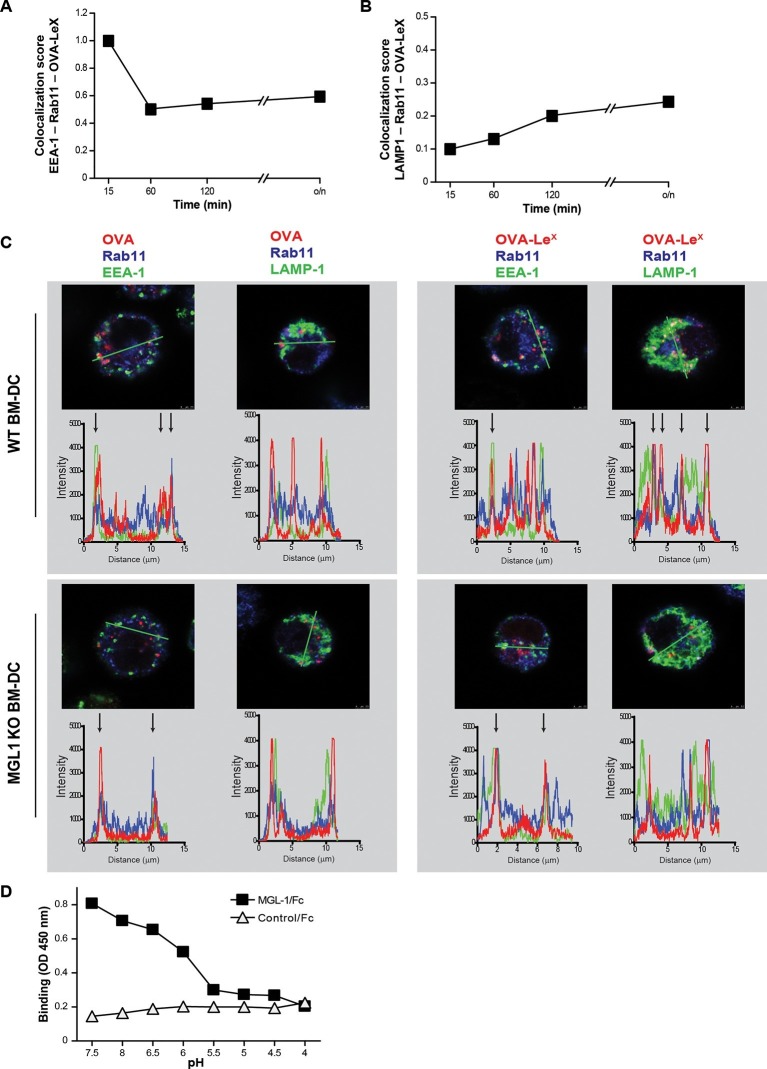
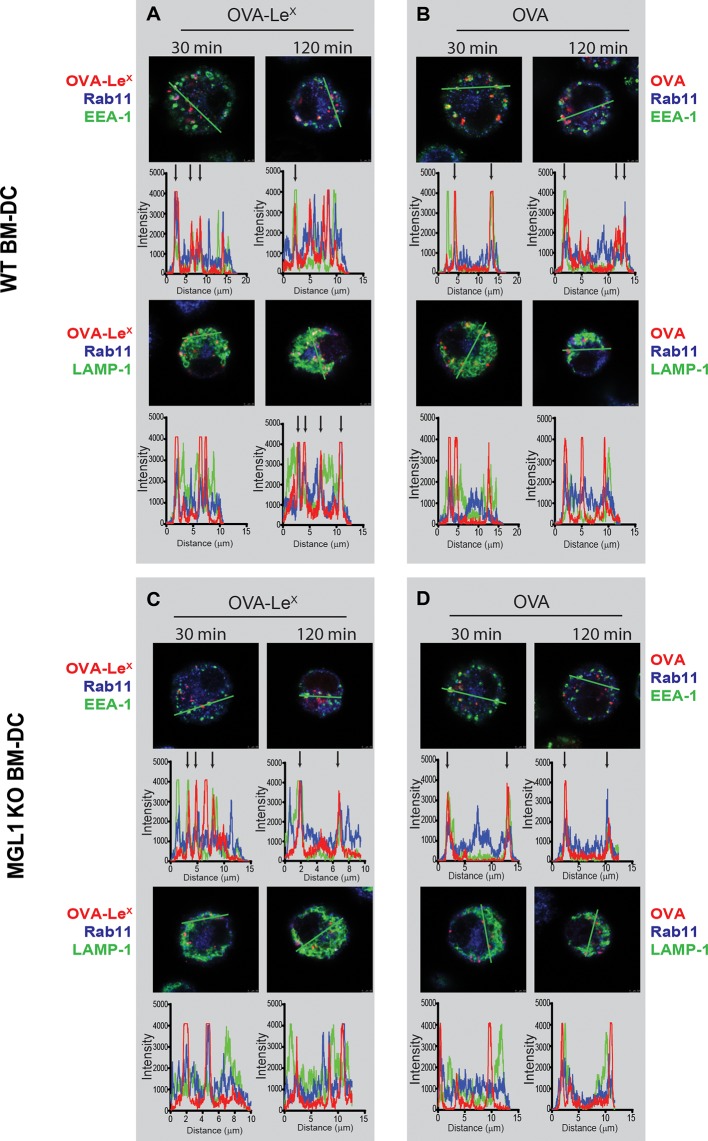
Figure 6. OVA-LeX is routed to Rab11+LAMP1+ compartments where it is stored for presentation in MHC class I.
(A, B) WT BM-DCs were pulsed with AlexaFluor 674-OVA-LeX (30 µg/ml) and chased at the indicated time-points to assess triple co-localization scores of OVA-LeX with (A) EEA-1 and Rab11 or (B) LAMP1 and Rab11 using imaging flow cytometry. (C) WT (upper panels) and MGL1 KO (lower panels) BM-DCs were incubated with Dylight-633-OVA-LeX or native OVA (30 µg/ml) and 2h later co-localization of OVA antigen (Red) with early endosomal (EEA-1, Green) or endosomal/lysosomal (LAMP1, Green) and recycling endosomal (Rab11, Blue) compartments was analyzed using CSLM. From a z-stack, histograms were created for a selected area (indicated by a line, upper part of each panel) using the Leica confocal software. Histograms were created from each fluorochrome and overlays were made by the program. Arrows indicate co-localization of antigen (Red) with EEA1&Rab11 or LAMP1&Rab11. (D) MGL1-Fc binding to LeX-PAA was determined at indicated pH by ELISA.
Figure 6—figure supplement 1. Examples of WT BM-DCs pulsed with AlexaFluor 674-OVA-LeX displaying high co-localization of OVA-LeX with EEA-1 and Rab11 as measured by imaging flow cytometry.

Figure 6—figure supplement 2. Examples of WT BM-DCs pulsed with AlexaFluor 674-OVA-LeX displaying high co-localization of OVA-LeX with LAMP1 and Rab11 as measured by imaging flow cytometry.


