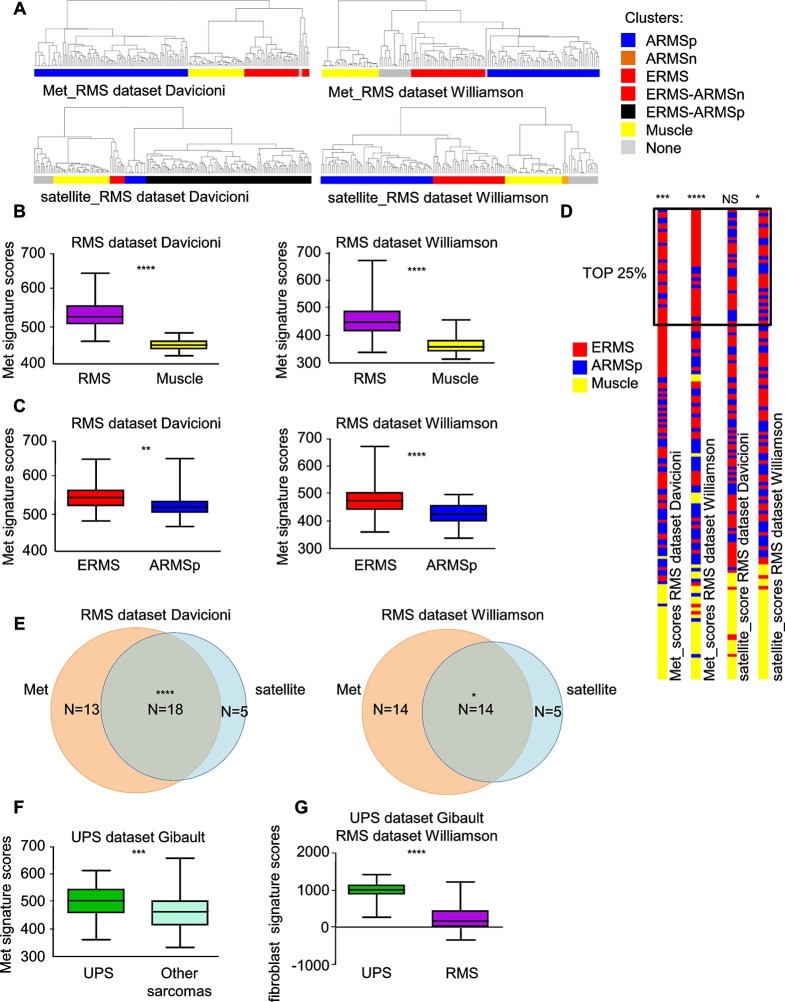
Figure 1. Met and satellite signatures are both preferentially associated with the ERMS subtype, while UPS show high Met and fibroblast scores.
(A) Unsupervised hierarchical clustering of RMS samples according to the Met or satellite signature genes; colors highlight RMS subtype enrichment in single clusters (ARMSp: translocation positive; ARMSn: translocation negative). (B) Box-plot of the Met signature scores for RMS and muscles in the indicated datasets. ****p<0.0001 (t test). (C) Box-plot of the Met signature scores for ERMS and ARMSp in the indicated datasets. **p<0.01; ****p<0.0001 (t test). (D) Ranked distribution of RMS subtypes according to the indicated signature scores. The boxed area includes the top 25% samples. NSp>0.05; *p<0.05; ***p<0.001; ****p<0.0001 (hypergeometric test). (E) Venn diagrams of ERMS included in the box in D, showing a significant intersection between high Met and high satellite signatures. *p<0.05; ****p<0.0001 (hypergeometric test). (F) Box-plot of the Met signature scores for UPS and other sarcomas in the indicated dataset. ***p<0.001 (t test). (G) Box-plot of the fibroblast signature scores for UPS and RMS in the indicated datasets. ****p<0.0001 (t test).


