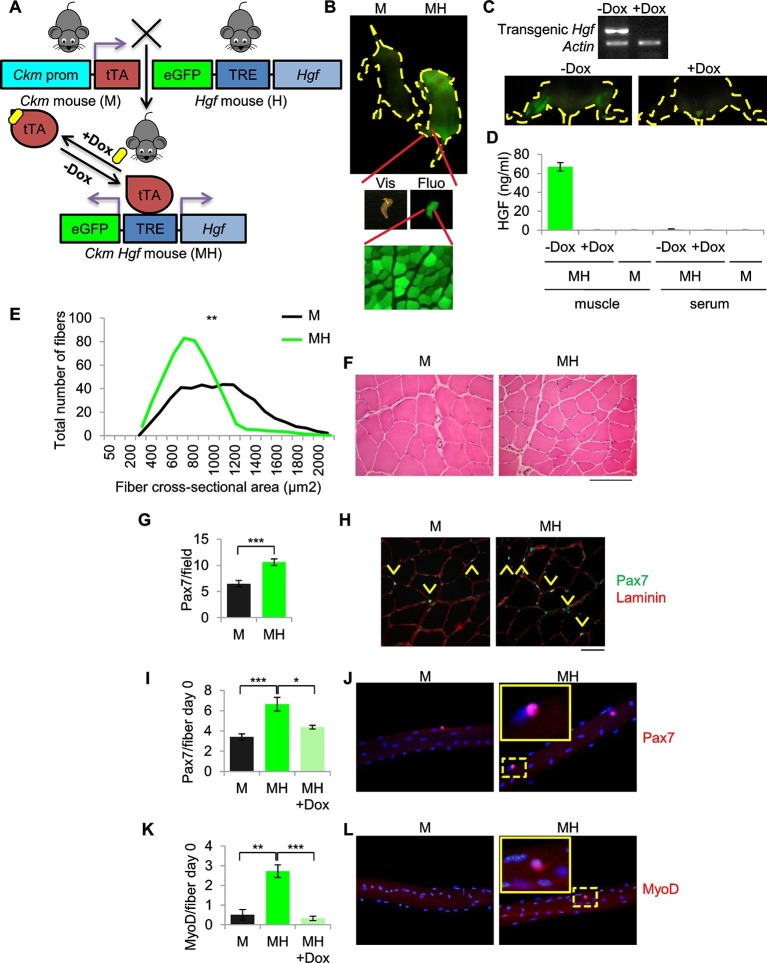
Figure 2. SC niche perturbation results in satellite cells activation.
(A) Schematic representation of the system used to generate Ckm-Tet-Off Hgf (MH) mice. In the absence of Doxycycline (-Dox), tTA binds to the Tetracycline Responsive Element (TRE), inducing the expression of HGF and eGFP in skeletal muscle. (B) Upper panel: fluorescent image of P10 mice. Middle panel: MH hindlimb under visible (Vis) and fluorescent (Fluo) light. Lower panel: fluorescent image of a muscle cross-section of a MH mouse. (C) Upper panel: semi-quantitative RT PCR of the indicated genes on Tibialis anterior muscles. Lower panel: fluorescent images of hindlimbs from a MH mouse with or without Dox treatment. (D) HGF-ELISA quantification in muscle and serum extracts from Dox-treated or control mice. (E) Distribution of Tibialis anterior cross-sectional areas showing a leftward shift in MH mice relative to their respective M controls. The mean value for MH mice was 585 ± 37 µm2 (n=8); the mean value for control M mice was 844 ± 63 µm2 (n=10). **p<0.01 (t test). (F) Representative H&E staining of Tibialis anterior cross sections. (Scale bar = 100 µm). (G) Quantification (mean ± SEM) of Pax7 positive cells/field in Tibialis anterior sections (M mice n=7; MH mice n=6). ***p<0.001 (t test). (H) Representative immunofluorescence of Pax7 (green), Laminin (red) and DAPI (blue) staining in G. Arrowheads indicate Pax7-positive cells. (Scale bar = 50 µm). (I) Quantification (mean ± SEM) of Pax7 positive cells/fiber after single fiber isolation (M mice n=13; MH mice n=12; MH +Dox n=2). *p<0.05; ***p<0.001 (t test). (J) Representative immunofluorescence of Pax7 (red) and DAPI (blue) staining in I. (K) Quantification (mean ± SEM) of MyoD-positive cells/fiber after single fiber isolation (M mice n=3; MH mice n=3; MH +Dox n=4). **p<0.01; ***p<0.001 (t test). (L) Representative immunofluorescence of MyoD (red) and DAPI (blue) staining in K. Dashed areas are shown at threefold magnification.


