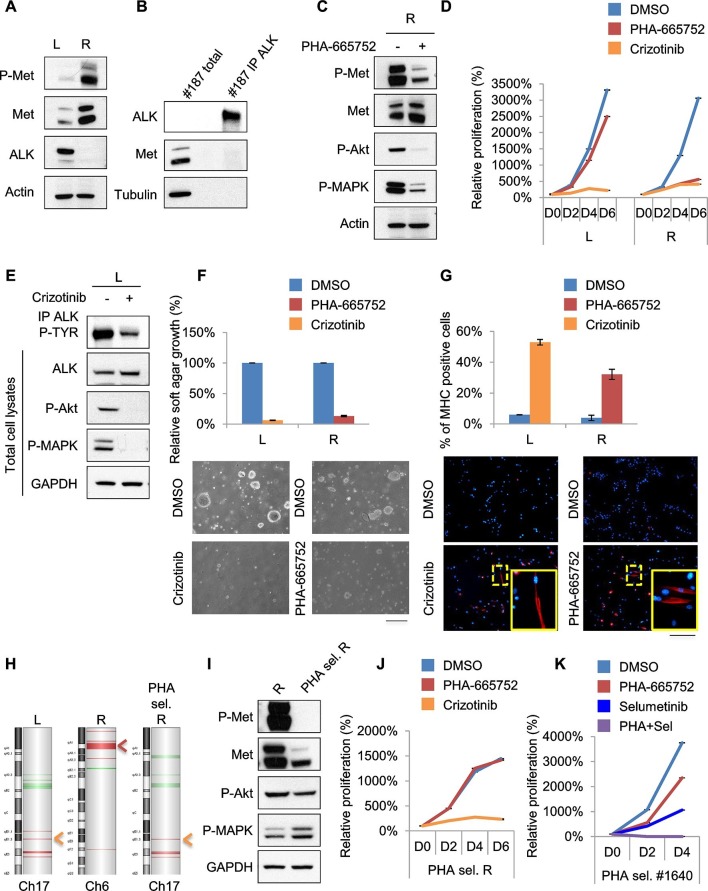
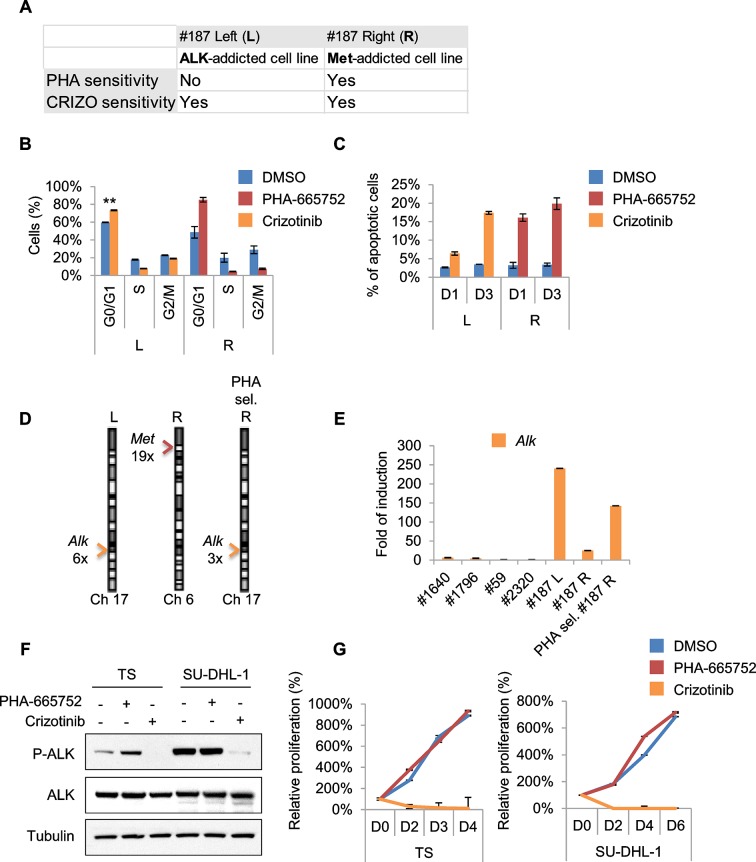
Figure 7. Treatments based on combination therapy can be effective in preventing ERMS recurrence and clonal evolution.
(A) Western blot analysis on the indicated proteins in L and R cells. (B) Western blot on total lysate and ALK-immunoprecipitated fraction of #187 ERMS tumor. (C) Western blot analysis of R cells treated with PHA for 2 hr. (D) Proliferation analysis (mean ± SD) of L and R cells treated with the indicated inhibitors. The number of cells at day 0 was set at 100%, representative assay of at least 2 independent experiments. (E) Western blot analysis on total cell lysate and ALK-immunoprecipitated fraction of L cells, treated with 500 nM Crizotinib for 2 hr. (F) Quantification and representative images of soft agar growth assays of L and R cells treated with the indicated inhibitors. The number of colonies obtained from cells in DMSO control was set at 100% (2 independent experiments, mean ± SEM). (Scale bar = 500 µm). (G) MHC expression analysis and representative MHC immunostaining of L and R cells, treated with the indicated inhibitors for 3 days (2 independent experiments, mean ± SEM). Dashed areas are shown at threefold magnification. (Scale bar = 250 µm). (H) CGH analysis of MHI-null ERMS cell lines. Red indicates copy number gain, green indicates copy number loss. Arrowheads mark Alk (orange) and Met (red) loci. (I) Western blot analysis of R and PHA-selected R cells. (J) Proliferation analysis (mean ± SD) of PHA-selected R cells treated with the indicated inhibitors. The number of cells at day 0 was set at 100%, representative assay of at least 2 independent experiments. (K) Proliferation analysis (mean ± SD) of PHA-selected #1640 cells treated with the indicated inhibitors. The number of cells at day 0 was set at 100%, representative assay of at least 2 independent experiments.


