. 2016 Mar 22;5:e09376. doi: 10.7554/eLife.09376

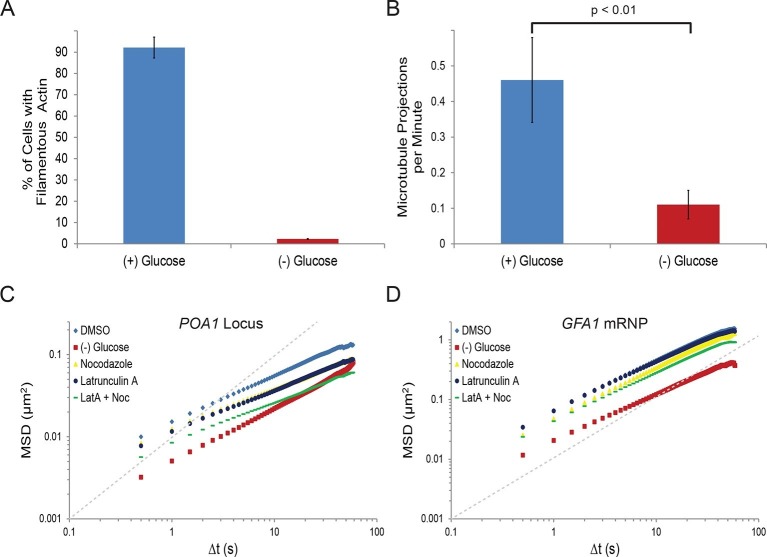
Figure 2. Starvation confines both cytoskeleton-independent macromolecular mobility and mobility influenced by the cytoskeleton (Figure 2—figure supplement 1).

(A) Quantification of filamentous actin during logarithmic growth, (+) glucose, and after acute starvation, (–) glucose. Cells were fixed and stained with phalloidin. Z-stack projections were then processed and cells were classified based on the presence or absence of filamentous actin. Error bars are standard error for three biological replicates (n = 406–709 cells per replicate). (B) Average number of microtubule projections per G1 cell during logarithmic growth, (+) glucose, and after acute starvation, (–) glucose. Error bars are standard deviation (SD) of the mean from three biological replicates (n = 10–1510-15 cells per replicate). The p-value for a two-tailed t-test for unpaired values assuming equal variance is shown. (C) Log-log MSD plot of the POA1 locus after treatment with nocodazole and/or latrunculin-A (LatA) for 20 min prior to imaging. (D) Log-log MSD plot of the GFA1 mRNP after treatment as described in (C). Dashed gray lines represent a slope of one to guide the eye.

DOI: http://dx.doi.org/10.7554/eLife.09376.007

Figure 2.

Figure 2—figure supplement 1. Starvation confines the cytoskeleton-independent mobility of mRNPs and the cytoskeleton-influenced mobility of chromatin.

Figure 2—figure supplement 1.

(A) Log-log MSD plot of the FBA1 mRNP after treatment as described in Figure 2C. (B) Log-log MSD plot of the URA3 locus after treatment as described in Figure 2C. (C) Log-log MSD plot of the pLacO plasmid after treatment as described in Figure 2C. (D) Graphic depicting the quantification of intranuclear displacements between the PES4 locus (green) and the POA1 locus (red). (E) Log-log interchromosomal MSDs quantifying the displacement between POA1 and PES4 during logarithmic growth, (+) glucose, and after acute starvation, (–) glucose. Images were acquired every 1.5 s for a total of 150 s, and the intranuclear displacements between the POA1 locus and the PES4 locus were tracked over time by determining the absolute distance between the two loci. (F) Log-log interchromosomal MSDs quantifying the displacement between POA1 and PES4 after inhibition of the cytoskeleton (nocodazole + LatA) and in a DMSO-treated control. Cells were treated as described in Figure 2C and imaged as in (E). Dashed gray lines represent a slope of one to guide the eye.