
Figure 5. Starvation induces a constriction in cell size and an expansion in vacuolar volume (Figure 5—figure supplements 1 and 2).
(A) Nuclear volume after acute glucose starvation. Histograms of nuclear volumes measured by reconstruction from three-dimensional image stacks using Imaris. The p-value resulting from a two-tailed t-test on the average volume in each condition (unpaired values assuming equal variance) is p<0.001. (B) Histograms of cell volumes of log-growing and acutely starved yeast cells. Log-growing cells, (+) glucose, were acutely starved of glucose, (–) glucose, and cell volume was measured using a Beckman Coulter Multisizer 3 (see 'Materials and methods'). Approximately 50,000 cells were measured for each condition. (C) Cytoplasmic free GFP (green) and vacuolar membrane protein Vph1-mCherry (magenta) fluorescence images. Scale bar: 10 μm. (D) Quantification of vacuole-to-cell volume ratio. Error bars represent standard errors about the mean (N = 3 independent experiments with > 55 cells per experiment). (E) Log-log MSD plot of the POA1 locus after treatment with increasing concentrations of NaCl. Cells were imaged approximately 10 min after hyperosmotic shock. (F) Log-log MSD plot of the GFA1 mRNP after treatment as described in (E).

Figure 5—figure supplement 1. Histograms of cell volumes after various treatments.
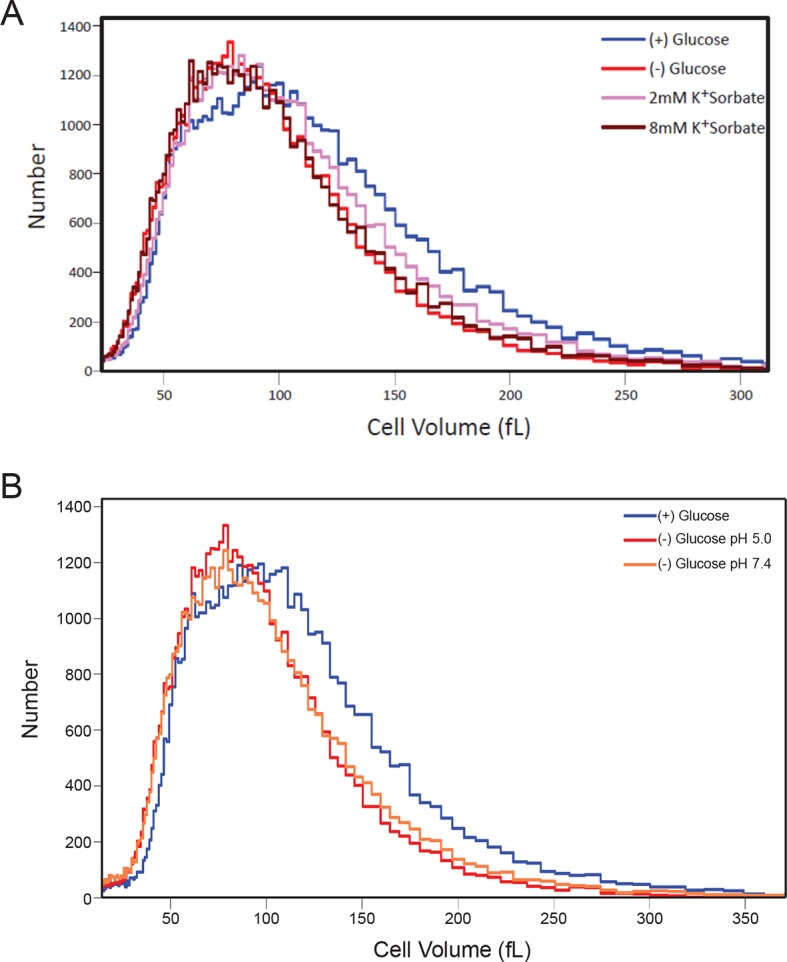
Figure 5—figure supplement 2. Hyperosmotic shock increasingly confines macromolecular mobility without affecting intracellular ATP concentrations or intracellular pH.
